Nigerian vs Immigrants from Mexico Per Capita Income
COMPARE
Nigerian
Immigrants from Mexico
Per Capita Income
Per Capita Income Comparison
Nigerians
Immigrants from Mexico
$41,026
PER CAPITA INCOME
4.9/ 100
METRIC RATING
229th/ 347
METRIC RANK
$33,931
PER CAPITA INCOME
0.0/ 100
METRIC RATING
331st/ 347
METRIC RANK
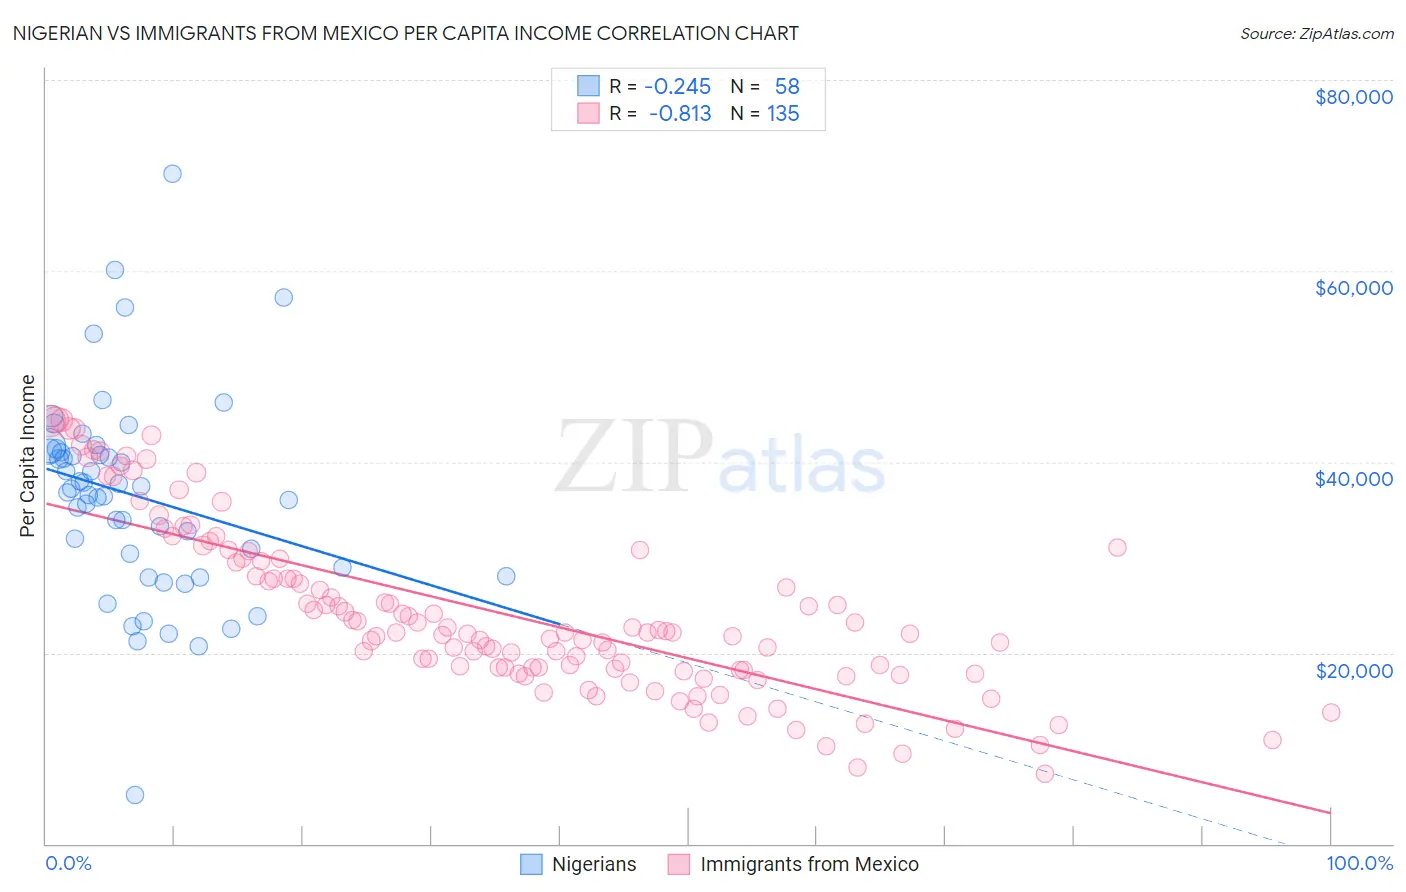
Nigerian vs Immigrants from Mexico Per Capita Income Correlation Chart
The statistical analysis conducted on geographies consisting of 332,796,588 people shows a weak negative correlation between the proportion of Nigerians and per capita income in the United States with a correlation coefficient (R) of -0.245 and weighted average of $41,026. Similarly, the statistical analysis conducted on geographies consisting of 513,776,249 people shows a very strong negative correlation between the proportion of Immigrants from Mexico and per capita income in the United States with a correlation coefficient (R) of -0.813 and weighted average of $33,931, a difference of 20.9%.
Per Capita Income Correlation Summary
| Measurement | Nigerian | Immigrants from Mexico |
| Minimum | $5,085 | $7,365 |
| Maximum | $70,186 | $44,424 |
| Range | $65,101 | $37,059 |
| Mean | $36,468 | $24,192 |
| Median | $37,024 | $22,163 |
| Interquartile 25% (IQ1) | $28,928 | $18,195 |
| Interquartile 75% (IQ3) | $41,176 | $29,815 |
| Interquartile Range (IQR) | $12,248 | $11,620 |
| Standard Deviation (Sample) | $10,721 | $8,892 |
| Standard Deviation (Population) | $10,628 | $8,859 |
Similar Demographics by Per Capita Income
Demographics Similar to Nigerians by Per Capita Income
In terms of per capita income, the demographic groups most similar to Nigerians are Native Hawaiian ($41,017, a difference of 0.020%), Senegalese ($41,000, a difference of 0.060%), Guyanese ($40,949, a difference of 0.19%), Immigrants from Grenada ($41,123, a difference of 0.24%), and Immigrants from Ghana ($41,131, a difference of 0.26%).
| Demographics | Rating | Rank | Per Capita Income |
| Immigrants | Iraq | 7.1 /100 | #222 | Tragic $41,365 |
| Immigrants | Cameroon | 6.8 /100 | #223 | Tragic $41,334 |
| Immigrants | St. Vincent and the Grenadines | 6.4 /100 | #224 | Tragic $41,270 |
| West Indians | 6.0 /100 | #225 | Tragic $41,217 |
| Immigrants | Ecuador | 5.9 /100 | #226 | Tragic $41,195 |
| Immigrants | Ghana | 5.5 /100 | #227 | Tragic $41,131 |
| Immigrants | Grenada | 5.5 /100 | #228 | Tragic $41,123 |
| Nigerians | 4.9 /100 | #229 | Tragic $41,026 |
| Native Hawaiians | 4.9 /100 | #230 | Tragic $41,017 |
| Senegalese | 4.8 /100 | #231 | Tragic $41,000 |
| Guyanese | 4.5 /100 | #232 | Tragic $40,949 |
| Delaware | 3.8 /100 | #233 | Tragic $40,778 |
| Immigrants | West Indies | 3.7 /100 | #234 | Tragic $40,763 |
| Immigrants | Guyana | 3.6 /100 | #235 | Tragic $40,742 |
| Immigrants | Nonimmigrants | 3.4 /100 | #236 | Tragic $40,669 |
Demographics Similar to Immigrants from Mexico by Per Capita Income
In terms of per capita income, the demographic groups most similar to Immigrants from Mexico are Sioux ($33,921, a difference of 0.030%), Immigrants from Yemen ($33,696, a difference of 0.70%), Spanish American Indian ($34,195, a difference of 0.78%), Mexican ($34,559, a difference of 1.8%), and Menominee ($34,578, a difference of 1.9%).
| Demographics | Rating | Rank | Per Capita Income |
| Kiowa | 0.0 /100 | #324 | Tragic $35,102 |
| Immigrants | Central America | 0.0 /100 | #325 | Tragic $34,974 |
| Immigrants | Cuba | 0.0 /100 | #326 | Tragic $34,910 |
| Apache | 0.0 /100 | #327 | Tragic $34,886 |
| Menominee | 0.0 /100 | #328 | Tragic $34,578 |
| Mexicans | 0.0 /100 | #329 | Tragic $34,559 |
| Spanish American Indians | 0.0 /100 | #330 | Tragic $34,195 |
| Immigrants | Mexico | 0.0 /100 | #331 | Tragic $33,931 |
| Sioux | 0.0 /100 | #332 | Tragic $33,921 |
| Immigrants | Yemen | 0.0 /100 | #333 | Tragic $33,696 |
| Natives/Alaskans | 0.0 /100 | #334 | Tragic $33,279 |
| Yuman | 0.0 /100 | #335 | Tragic $33,236 |
| Yakama | 0.0 /100 | #336 | Tragic $33,009 |
| Houma | 0.0 /100 | #337 | Tragic $32,996 |
| Arapaho | 0.0 /100 | #338 | Tragic $32,345 |