Dominican vs Fijian Seniors Poverty Over the Age of 75
COMPARE
Dominican
Fijian
Seniors Poverty Over the Age of 75
Seniors Poverty Over the Age of 75 Comparison
Dominicans
Fijians
19.6%
SENIORS POVERTY OVER THE AGE OF 75
0.0/ 100
METRIC RATING
342nd/ 347
METRIC RANK
11.8%
SENIORS POVERTY OVER THE AGE OF 75
83.8/ 100
METRIC RATING
124th/ 347
METRIC RANK
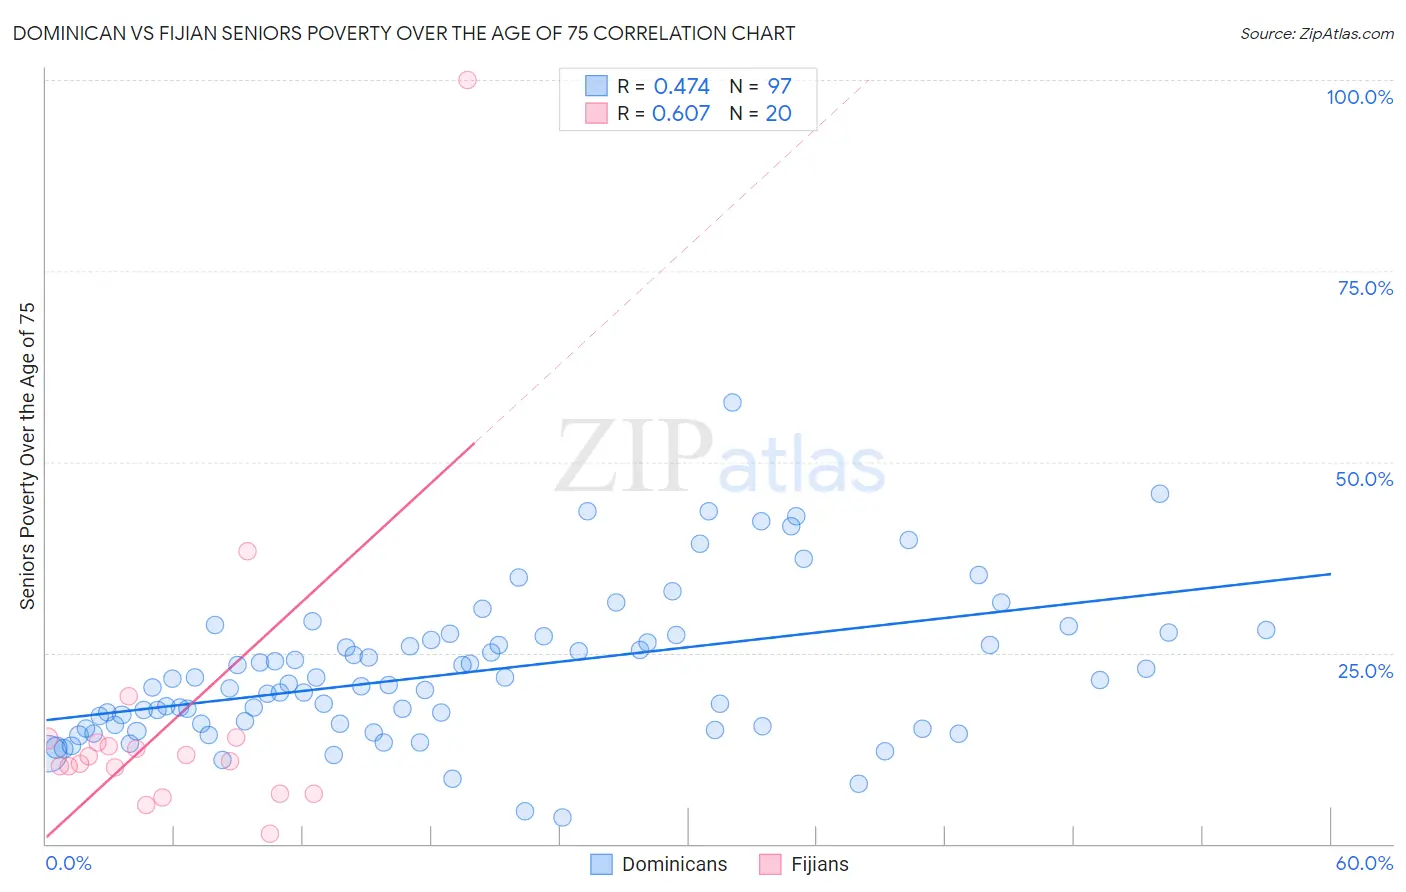
Dominican vs Fijian Seniors Poverty Over the Age of 75 Correlation Chart
The statistical analysis conducted on geographies consisting of 350,851,052 people shows a moderate positive correlation between the proportion of Dominicans and poverty level among seniors over the age of 75 in the United States with a correlation coefficient (R) of 0.474 and weighted average of 19.6%. Similarly, the statistical analysis conducted on geographies consisting of 55,762,719 people shows a significant positive correlation between the proportion of Fijians and poverty level among seniors over the age of 75 in the United States with a correlation coefficient (R) of 0.607 and weighted average of 11.8%, a difference of 66.5%.
Seniors Poverty Over the Age of 75 Correlation Summary
| Measurement | Dominican | Fijian |
| Minimum | 3.4% | 1.2% |
| Maximum | 57.7% | 100.0% |
| Range | 54.4% | 98.8% |
| Mean | 22.5% | 16.2% |
| Median | 20.8% | 11.1% |
| Interquartile 25% (IQ1) | 15.5% | 8.2% |
| Interquartile 75% (IQ3) | 27.0% | 13.5% |
| Interquartile Range (IQR) | 11.5% | 5.3% |
| Standard Deviation (Sample) | 9.7% | 21.1% |
| Standard Deviation (Population) | 9.6% | 20.5% |
Similar Demographics by Seniors Poverty Over the Age of 75
Demographics Similar to Dominicans by Seniors Poverty Over the Age of 75
In terms of seniors poverty over the age of 75, the demographic groups most similar to Dominicans are Lumbee (19.7%, a difference of 0.66%), Navajo (19.4%, a difference of 1.2%), Immigrants from Cuba (19.9%, a difference of 1.5%), Immigrants from Dominican Republic (20.1%, a difference of 2.2%), and Tohono O'odham (19.1%, a difference of 2.5%).
| Demographics | Rating | Rank | Seniors Poverty Over the Age of 75 |
| Immigrants | Nicaragua | 0.0 /100 | #333 | Tragic 17.6% |
| Immigrants | Grenada | 0.0 /100 | #334 | Tragic 17.8% |
| Cubans | 0.0 /100 | #335 | Tragic 18.0% |
| Immigrants | Caribbean | 0.0 /100 | #336 | Tragic 18.2% |
| Yakama | 0.0 /100 | #337 | Tragic 18.3% |
| Immigrants | Cabo Verde | 0.0 /100 | #338 | Tragic 18.5% |
| Hopi | 0.0 /100 | #339 | Tragic 18.9% |
| Tohono O'odham | 0.0 /100 | #340 | Tragic 19.1% |
| Navajo | 0.0 /100 | #341 | Tragic 19.4% |
| Dominicans | 0.0 /100 | #342 | Tragic 19.6% |
| Lumbee | 0.0 /100 | #343 | Tragic 19.7% |
| Immigrants | Cuba | 0.0 /100 | #344 | Tragic 19.9% |
| Immigrants | Dominican Republic | 0.0 /100 | #345 | Tragic 20.1% |
| Puerto Ricans | 0.0 /100 | #346 | Tragic 23.2% |
| Pima | 0.0 /100 | #347 | Tragic 23.9% |
Demographics Similar to Fijians by Seniors Poverty Over the Age of 75
In terms of seniors poverty over the age of 75, the demographic groups most similar to Fijians are Pakistani (11.8%, a difference of 0.030%), Immigrants from Italy (11.8%, a difference of 0.030%), Sudanese (11.8%, a difference of 0.030%), Malaysian (11.8%, a difference of 0.040%), and Pennsylvania German (11.8%, a difference of 0.060%).
| Demographics | Rating | Rank | Seniors Poverty Over the Age of 75 |
| Icelanders | 85.7 /100 | #117 | Excellent 11.7% |
| Immigrants | Zimbabwe | 85.5 /100 | #118 | Excellent 11.7% |
| Immigrants | Uganda | 84.8 /100 | #119 | Excellent 11.8% |
| Immigrants | Nepal | 84.5 /100 | #120 | Excellent 11.8% |
| Malaysians | 84.1 /100 | #121 | Excellent 11.8% |
| Pakistanis | 84.0 /100 | #122 | Excellent 11.8% |
| Immigrants | Italy | 84.0 /100 | #123 | Excellent 11.8% |
| Fijians | 83.8 /100 | #124 | Excellent 11.8% |
| Sudanese | 83.6 /100 | #125 | Excellent 11.8% |
| Pennsylvania Germans | 83.4 /100 | #126 | Excellent 11.8% |
| Immigrants | Denmark | 82.6 /100 | #127 | Excellent 11.8% |
| Immigrants | Hungary | 81.7 /100 | #128 | Excellent 11.8% |
| Ethiopians | 80.7 /100 | #129 | Excellent 11.8% |
| Spanish | 80.5 /100 | #130 | Excellent 11.8% |
| Immigrants | Western Europe | 79.6 /100 | #131 | Good 11.9% |