Russian vs Fijian Per Capita Income
COMPARE
Russian
Fijian
Per Capita Income
Per Capita Income Comparison
Russians
Fijians
$53,154
PER CAPITA INCOME
100.0/ 100
METRIC RATING
26th/ 347
METRIC RANK
$36,690
PER CAPITA INCOME
0.0/ 100
METRIC RATING
308th/ 347
METRIC RANK
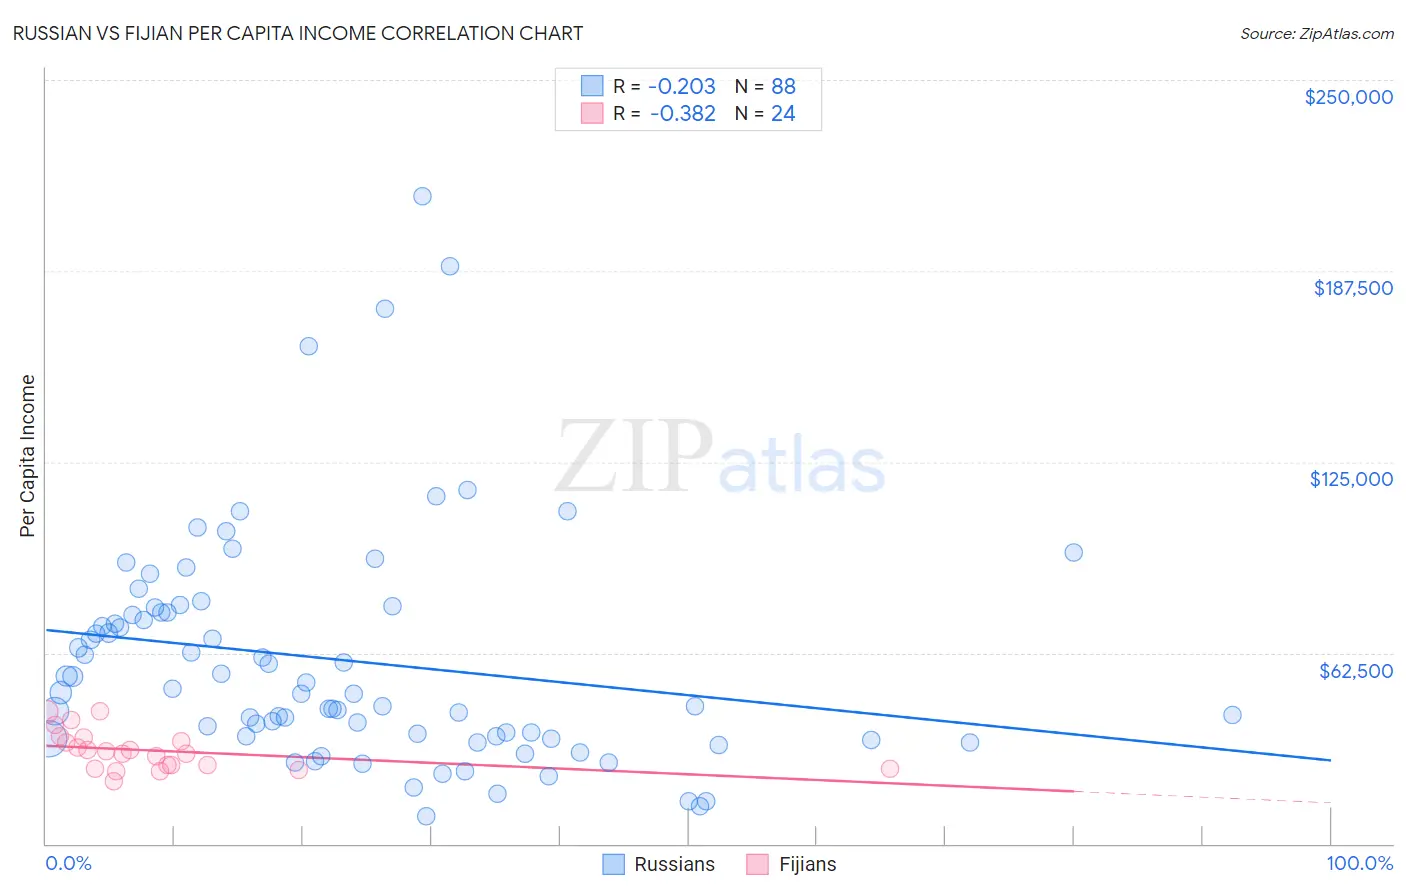
Russian vs Fijian Per Capita Income Correlation Chart
The statistical analysis conducted on geographies consisting of 512,304,099 people shows a weak negative correlation between the proportion of Russians and per capita income in the United States with a correlation coefficient (R) of -0.203 and weighted average of $53,154. Similarly, the statistical analysis conducted on geographies consisting of 55,948,768 people shows a mild negative correlation between the proportion of Fijians and per capita income in the United States with a correlation coefficient (R) of -0.382 and weighted average of $36,690, a difference of 44.9%.
Per Capita Income Correlation Summary
| Measurement | Russian | Fijian |
| Minimum | $9,193 | $20,445 |
| Maximum | $212,036 | $43,340 |
| Range | $202,843 | $22,895 |
| Mean | $59,937 | $30,488 |
| Median | $49,383 | $29,934 |
| Interquartile 25% (IQ1) | $34,688 | $25,226 |
| Interquartile 75% (IQ3) | $75,613 | $34,063 |
| Interquartile Range (IQR) | $40,926 | $8,837 |
| Standard Deviation (Sample) | $37,845 | $6,360 |
| Standard Deviation (Population) | $37,630 | $6,227 |
Similar Demographics by Per Capita Income
Demographics Similar to Russians by Per Capita Income
In terms of per capita income, the demographic groups most similar to Russians are Immigrants from Japan ($53,359, a difference of 0.39%), Immigrants from South Central Asia ($52,660, a difference of 0.94%), Latvian ($52,649, a difference of 0.96%), Israeli ($52,596, a difference of 1.1%), and Immigrants from Denmark ($53,799, a difference of 1.2%).
| Demographics | Rating | Rank | Per Capita Income |
| Immigrants | China | 100.0 /100 | #19 | Exceptional $54,264 |
| Soviet Union | 100.0 /100 | #20 | Exceptional $54,202 |
| Immigrants | Northern Europe | 100.0 /100 | #21 | Exceptional $54,159 |
| Indians (Asian) | 100.0 /100 | #22 | Exceptional $53,874 |
| Immigrants | Eastern Asia | 100.0 /100 | #23 | Exceptional $53,806 |
| Immigrants | Denmark | 100.0 /100 | #24 | Exceptional $53,799 |
| Immigrants | Japan | 100.0 /100 | #25 | Exceptional $53,359 |
| Russians | 100.0 /100 | #26 | Exceptional $53,154 |
| Immigrants | South Central Asia | 100.0 /100 | #27 | Exceptional $52,660 |
| Latvians | 100.0 /100 | #28 | Exceptional $52,649 |
| Israelis | 100.0 /100 | #29 | Exceptional $52,596 |
| Immigrants | Austria | 100.0 /100 | #30 | Exceptional $52,503 |
| Turks | 100.0 /100 | #31 | Exceptional $52,391 |
| Immigrants | Norway | 100.0 /100 | #32 | Exceptional $52,217 |
| Australians | 100.0 /100 | #33 | Exceptional $52,074 |
Demographics Similar to Fijians by Per Capita Income
In terms of per capita income, the demographic groups most similar to Fijians are Immigrants from Honduras ($36,665, a difference of 0.070%), Ute ($36,651, a difference of 0.10%), Chippewa ($36,631, a difference of 0.16%), Immigrants from Latin America ($36,823, a difference of 0.36%), and Immigrants from Haiti ($36,849, a difference of 0.43%).
| Demographics | Rating | Rank | Per Capita Income |
| Ottawa | 0.1 /100 | #301 | Tragic $37,101 |
| Shoshone | 0.1 /100 | #302 | Tragic $37,072 |
| Paiute | 0.1 /100 | #303 | Tragic $37,066 |
| Hondurans | 0.1 /100 | #304 | Tragic $37,031 |
| Inupiat | 0.1 /100 | #305 | Tragic $36,999 |
| Immigrants | Haiti | 0.0 /100 | #306 | Tragic $36,849 |
| Immigrants | Latin America | 0.0 /100 | #307 | Tragic $36,823 |
| Fijians | 0.0 /100 | #308 | Tragic $36,690 |
| Immigrants | Honduras | 0.0 /100 | #309 | Tragic $36,665 |
| Ute | 0.0 /100 | #310 | Tragic $36,651 |
| Chippewa | 0.0 /100 | #311 | Tragic $36,631 |
| Chickasaw | 0.0 /100 | #312 | Tragic $36,475 |
| Bahamians | 0.0 /100 | #313 | Tragic $36,427 |
| Seminole | 0.0 /100 | #314 | Tragic $36,180 |
| Yaqui | 0.0 /100 | #315 | Tragic $36,112 |