Czech vs Osage Per Capita Income
COMPARE
Czech
Osage
Per Capita Income
Per Capita Income Comparison
Czechs
Osage
$44,595
PER CAPITA INCOME
74.1/ 100
METRIC RATING
147th/ 347
METRIC RANK
$39,568
PER CAPITA INCOME
1.0/ 100
METRIC RATING
253rd/ 347
METRIC RANK
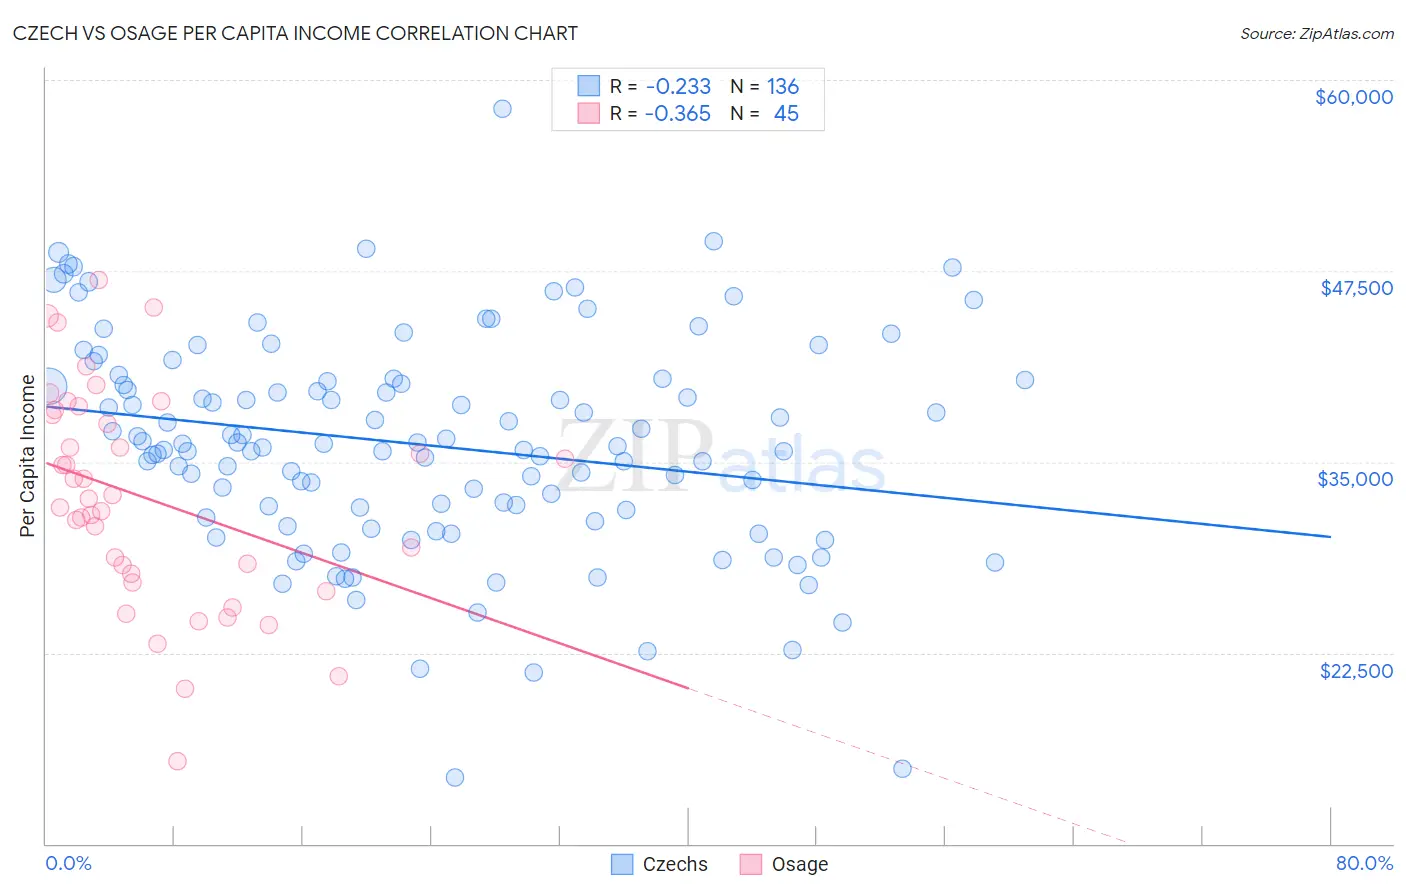
Czech vs Osage Per Capita Income Correlation Chart
The statistical analysis conducted on geographies consisting of 484,845,584 people shows a weak negative correlation between the proportion of Czechs and per capita income in the United States with a correlation coefficient (R) of -0.233 and weighted average of $44,595. Similarly, the statistical analysis conducted on geographies consisting of 91,808,929 people shows a mild negative correlation between the proportion of Osage and per capita income in the United States with a correlation coefficient (R) of -0.365 and weighted average of $39,568, a difference of 12.7%.
Per Capita Income Correlation Summary
| Measurement | Czech | Osage |
| Minimum | $14,339 | $15,396 |
| Maximum | $58,093 | $46,906 |
| Range | $43,754 | $31,510 |
| Mean | $36,126 | $32,578 |
| Median | $36,098 | $32,608 |
| Interquartile 25% (IQ1) | $31,633 | $27,395 |
| Interquartile 75% (IQ3) | $40,288 | $38,257 |
| Interquartile Range (IQR) | $8,655 | $10,862 |
| Standard Deviation (Sample) | $7,126 | $7,093 |
| Standard Deviation (Population) | $7,100 | $7,014 |
Similar Demographics by Per Capita Income
Demographics Similar to Czechs by Per Capita Income
In terms of per capita income, the demographic groups most similar to Czechs are Immigrants from Armenia ($44,552, a difference of 0.10%), Korean ($44,522, a difference of 0.16%), Irish ($44,679, a difference of 0.19%), Immigrants from Eritrea ($44,509, a difference of 0.19%), and Norwegian ($44,480, a difference of 0.26%).
| Demographics | Rating | Rank | Per Capita Income |
| Immigrants | Jordan | 82.9 /100 | #140 | Excellent $45,066 |
| Slavs | 82.6 /100 | #141 | Excellent $45,049 |
| Ugandans | 82.6 /100 | #142 | Excellent $45,047 |
| Immigrants | Uganda | 82.5 /100 | #143 | Excellent $45,043 |
| Icelanders | 81.6 /100 | #144 | Excellent $44,987 |
| Immigrants | Afghanistan | 78.0 /100 | #145 | Good $44,790 |
| Irish | 75.8 /100 | #146 | Good $44,679 |
| Czechs | 74.1 /100 | #147 | Good $44,595 |
| Immigrants | Armenia | 73.1 /100 | #148 | Good $44,552 |
| Koreans | 72.5 /100 | #149 | Good $44,522 |
| Immigrants | Eritrea | 72.1 /100 | #150 | Good $44,509 |
| Norwegians | 71.5 /100 | #151 | Good $44,480 |
| Peruvians | 71.5 /100 | #152 | Good $44,479 |
| Scottish | 70.6 /100 | #153 | Good $44,440 |
| Portuguese | 68.7 /100 | #154 | Good $44,362 |
Demographics Similar to Osage by Per Capita Income
In terms of per capita income, the demographic groups most similar to Osage are Alaska Native ($39,558, a difference of 0.020%), Immigrants from the Azores ($39,608, a difference of 0.10%), Immigrants from Middle Africa ($39,529, a difference of 0.10%), Hawaiian ($39,403, a difference of 0.42%), and Nicaraguan ($39,372, a difference of 0.50%).
| Demographics | Rating | Rank | Per Capita Income |
| Cree | 1.7 /100 | #246 | Tragic $40,056 |
| Immigrants | Somalia | 1.6 /100 | #247 | Tragic $39,974 |
| Cape Verdeans | 1.5 /100 | #248 | Tragic $39,935 |
| Japanese | 1.4 /100 | #249 | Tragic $39,870 |
| Immigrants | Burma/Myanmar | 1.3 /100 | #250 | Tragic $39,827 |
| Samoans | 1.3 /100 | #251 | Tragic $39,826 |
| Immigrants | Azores | 1.0 /100 | #252 | Tragic $39,608 |
| Osage | 1.0 /100 | #253 | Tragic $39,568 |
| Alaska Natives | 1.0 /100 | #254 | Tragic $39,558 |
| Immigrants | Middle Africa | 1.0 /100 | #255 | Tragic $39,529 |
| Hawaiians | 0.8 /100 | #256 | Tragic $39,403 |
| Nicaraguans | 0.8 /100 | #257 | Tragic $39,372 |
| Jamaicans | 0.7 /100 | #258 | Tragic $39,231 |
| Malaysians | 0.7 /100 | #259 | Tragic $39,194 |
| Alaskan Athabascans | 0.6 /100 | #260 | Tragic $39,163 |