Immigrants from Turkey vs Osage Per Capita Income
COMPARE
Immigrants from Turkey
Osage
Per Capita Income
Per Capita Income Comparison
Immigrants from Turkey
Osage
$51,368
PER CAPITA INCOME
100.0/ 100
METRIC RATING
42nd/ 347
METRIC RANK
$39,568
PER CAPITA INCOME
1.0/ 100
METRIC RATING
253rd/ 347
METRIC RANK
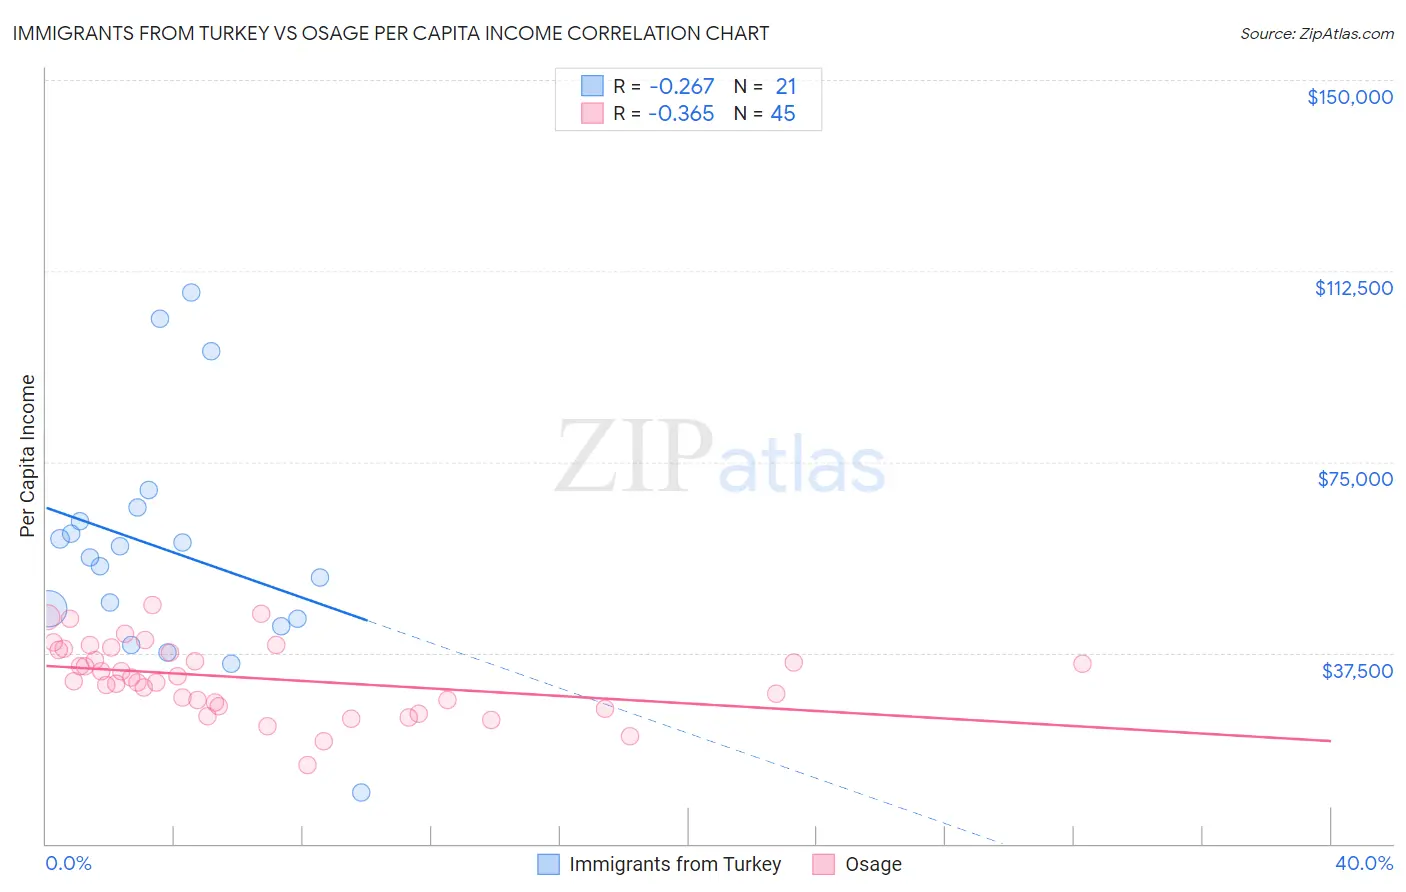
Immigrants from Turkey vs Osage Per Capita Income Correlation Chart
The statistical analysis conducted on geographies consisting of 223,057,840 people shows a weak negative correlation between the proportion of Immigrants from Turkey and per capita income in the United States with a correlation coefficient (R) of -0.267 and weighted average of $51,368. Similarly, the statistical analysis conducted on geographies consisting of 91,808,929 people shows a mild negative correlation between the proportion of Osage and per capita income in the United States with a correlation coefficient (R) of -0.365 and weighted average of $39,568, a difference of 29.8%.
Per Capita Income Correlation Summary
| Measurement | Immigrants from Turkey | Osage |
| Minimum | $10,156 | $15,396 |
| Maximum | $108,195 | $46,906 |
| Range | $98,039 | $31,510 |
| Mean | $57,681 | $32,578 |
| Median | $56,181 | $32,608 |
| Interquartile 25% (IQ1) | $43,465 | $27,395 |
| Interquartile 75% (IQ3) | $64,694 | $38,257 |
| Interquartile Range (IQR) | $21,229 | $10,862 |
| Standard Deviation (Sample) | $23,007 | $7,093 |
| Standard Deviation (Population) | $22,452 | $7,014 |
Similar Demographics by Per Capita Income
Demographics Similar to Immigrants from Turkey by Per Capita Income
In terms of per capita income, the demographic groups most similar to Immigrants from Turkey are Immigrants from Lithuania ($51,361, a difference of 0.010%), Immigrants from South Africa ($51,465, a difference of 0.19%), Immigrants from Korea ($51,671, a difference of 0.59%), Cambodian ($51,731, a difference of 0.71%), and Immigrants from Czechoslovakia ($51,770, a difference of 0.78%).
| Demographics | Rating | Rank | Per Capita Income |
| Burmese | 100.0 /100 | #35 | Exceptional $52,005 |
| Immigrants | Greece | 100.0 /100 | #36 | Exceptional $51,891 |
| Estonians | 100.0 /100 | #37 | Exceptional $51,875 |
| Immigrants | Czechoslovakia | 100.0 /100 | #38 | Exceptional $51,770 |
| Cambodians | 100.0 /100 | #39 | Exceptional $51,731 |
| Immigrants | Korea | 100.0 /100 | #40 | Exceptional $51,671 |
| Immigrants | South Africa | 100.0 /100 | #41 | Exceptional $51,465 |
| Immigrants | Turkey | 100.0 /100 | #42 | Exceptional $51,368 |
| Immigrants | Lithuania | 100.0 /100 | #43 | Exceptional $51,361 |
| Immigrants | Europe | 100.0 /100 | #44 | Exceptional $50,950 |
| Immigrants | Spain | 100.0 /100 | #45 | Exceptional $50,933 |
| Immigrants | Latvia | 100.0 /100 | #46 | Exceptional $50,914 |
| Bulgarians | 100.0 /100 | #47 | Exceptional $50,906 |
| Immigrants | Serbia | 100.0 /100 | #48 | Exceptional $50,810 |
| New Zealanders | 100.0 /100 | #49 | Exceptional $50,575 |
Demographics Similar to Osage by Per Capita Income
In terms of per capita income, the demographic groups most similar to Osage are Alaska Native ($39,558, a difference of 0.020%), Immigrants from the Azores ($39,608, a difference of 0.10%), Immigrants from Middle Africa ($39,529, a difference of 0.10%), Hawaiian ($39,403, a difference of 0.42%), and Nicaraguan ($39,372, a difference of 0.50%).
| Demographics | Rating | Rank | Per Capita Income |
| Cree | 1.7 /100 | #246 | Tragic $40,056 |
| Immigrants | Somalia | 1.6 /100 | #247 | Tragic $39,974 |
| Cape Verdeans | 1.5 /100 | #248 | Tragic $39,935 |
| Japanese | 1.4 /100 | #249 | Tragic $39,870 |
| Immigrants | Burma/Myanmar | 1.3 /100 | #250 | Tragic $39,827 |
| Samoans | 1.3 /100 | #251 | Tragic $39,826 |
| Immigrants | Azores | 1.0 /100 | #252 | Tragic $39,608 |
| Osage | 1.0 /100 | #253 | Tragic $39,568 |
| Alaska Natives | 1.0 /100 | #254 | Tragic $39,558 |
| Immigrants | Middle Africa | 1.0 /100 | #255 | Tragic $39,529 |
| Hawaiians | 0.8 /100 | #256 | Tragic $39,403 |
| Nicaraguans | 0.8 /100 | #257 | Tragic $39,372 |
| Jamaicans | 0.7 /100 | #258 | Tragic $39,231 |
| Malaysians | 0.7 /100 | #259 | Tragic $39,194 |
| Alaskan Athabascans | 0.6 /100 | #260 | Tragic $39,163 |