Delaware vs Eastern European Per Capita Income
COMPARE
Delaware
Eastern European
Per Capita Income
Per Capita Income Comparison
Delaware
Eastern Europeans
$40,778
PER CAPITA INCOME
3.8/ 100
METRIC RATING
233rd/ 347
METRIC RANK
$55,780
PER CAPITA INCOME
100.0/ 100
METRIC RATING
11th/ 347
METRIC RANK
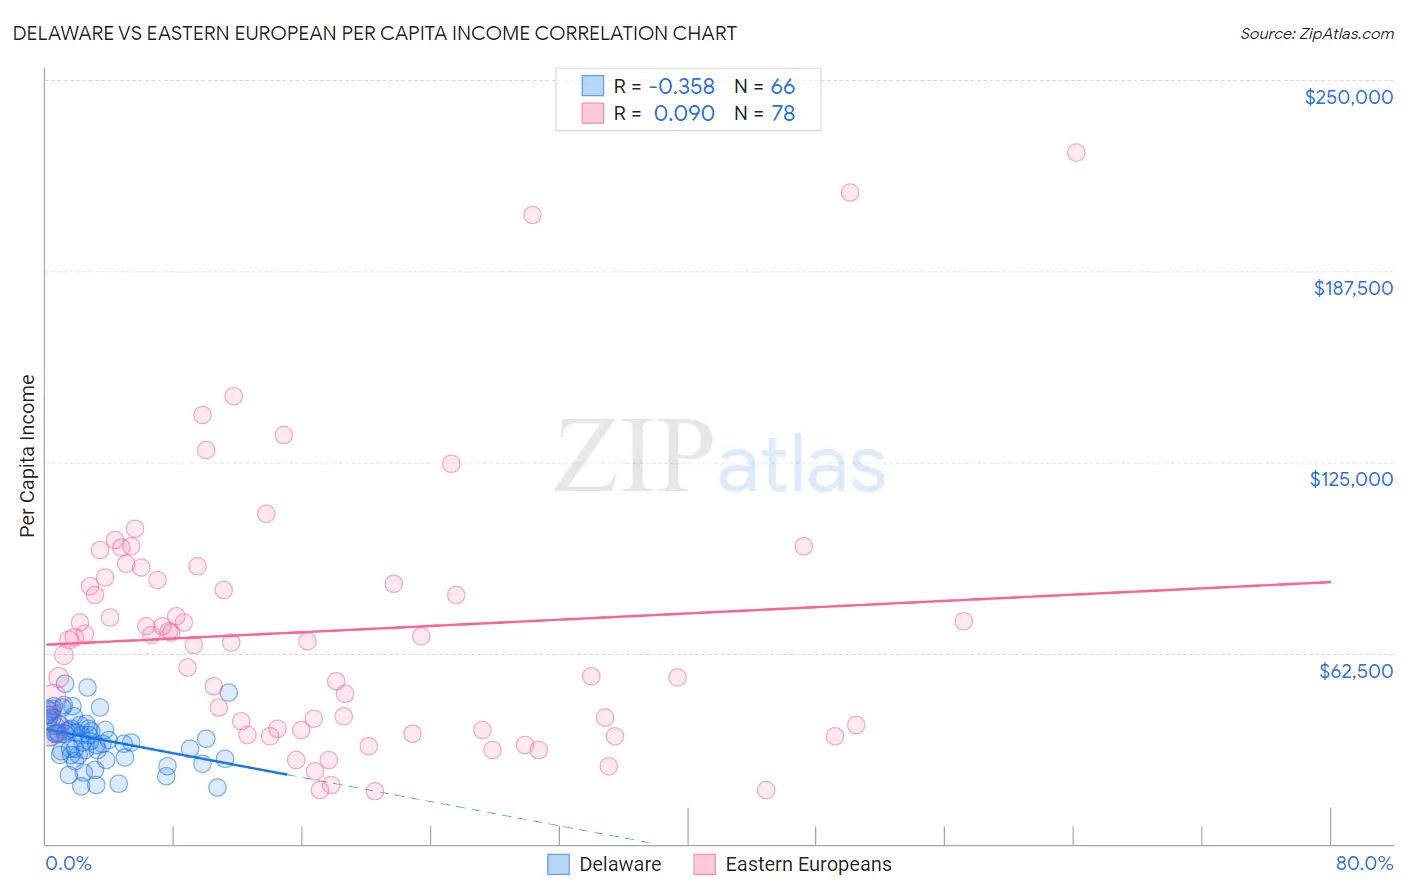
Delaware vs Eastern European Per Capita Income Correlation Chart
The statistical analysis conducted on geographies consisting of 96,239,490 people shows a mild negative correlation between the proportion of Delaware and per capita income in the United States with a correlation coefficient (R) of -0.358 and weighted average of $40,778. Similarly, the statistical analysis conducted on geographies consisting of 461,273,443 people shows a slight positive correlation between the proportion of Eastern Europeans and per capita income in the United States with a correlation coefficient (R) of 0.090 and weighted average of $55,780, a difference of 36.8%.
Per Capita Income Correlation Summary
| Measurement | Delaware | Eastern European |
| Minimum | $18,507 | $17,105 |
| Maximum | $52,470 | $226,072 |
| Range | $33,963 | $208,967 |
| Mean | $34,628 | $69,550 |
| Median | $35,673 | $66,546 |
| Interquartile 25% (IQ1) | $29,044 | $37,574 |
| Interquartile 75% (IQ3) | $39,167 | $86,383 |
| Interquartile Range (IQR) | $10,124 | $48,809 |
| Standard Deviation (Sample) | $7,889 | $42,028 |
| Standard Deviation (Population) | $7,829 | $41,758 |
Similar Demographics by Per Capita Income
Demographics Similar to Delaware by Per Capita Income
In terms of per capita income, the demographic groups most similar to Delaware are Immigrants from West Indies ($40,763, a difference of 0.040%), Immigrants from Guyana ($40,742, a difference of 0.090%), Nonimmigrants ($40,669, a difference of 0.27%), Guyanese ($40,949, a difference of 0.42%), and Senegalese ($41,000, a difference of 0.55%).
| Demographics | Rating | Rank | Per Capita Income |
| Immigrants | Ecuador | 5.9 /100 | #226 | Tragic $41,195 |
| Immigrants | Ghana | 5.5 /100 | #227 | Tragic $41,131 |
| Immigrants | Grenada | 5.5 /100 | #228 | Tragic $41,123 |
| Nigerians | 4.9 /100 | #229 | Tragic $41,026 |
| Native Hawaiians | 4.9 /100 | #230 | Tragic $41,017 |
| Senegalese | 4.8 /100 | #231 | Tragic $41,000 |
| Guyanese | 4.5 /100 | #232 | Tragic $40,949 |
| Delaware | 3.8 /100 | #233 | Tragic $40,778 |
| Immigrants | West Indies | 3.7 /100 | #234 | Tragic $40,763 |
| Immigrants | Guyana | 3.6 /100 | #235 | Tragic $40,742 |
| Immigrants | Nonimmigrants | 3.4 /100 | #236 | Tragic $40,669 |
| Immigrants | Cambodia | 2.6 /100 | #237 | Tragic $40,434 |
| Somalis | 2.4 /100 | #238 | Tragic $40,367 |
| Tsimshian | 2.4 /100 | #239 | Tragic $40,344 |
| Immigrants | Nigeria | 2.3 /100 | #240 | Tragic $40,339 |
Demographics Similar to Eastern Europeans by Per Capita Income
In terms of per capita income, the demographic groups most similar to Eastern Europeans are Okinawan ($55,817, a difference of 0.070%), Immigrants from Sweden ($55,582, a difference of 0.36%), Immigrants from India ($55,268, a difference of 0.93%), Immigrants from Belgium ($55,082, a difference of 1.3%), and Immigrants from Ireland ($56,584, a difference of 1.4%).
| Demographics | Rating | Rank | Per Capita Income |
| Immigrants | Australia | 100.0 /100 | #4 | Exceptional $57,953 |
| Immigrants | Iran | 100.0 /100 | #5 | Exceptional $57,759 |
| Immigrants | Taiwan | 100.0 /100 | #6 | Exceptional $57,742 |
| Immigrants | Israel | 100.0 /100 | #7 | Exceptional $57,384 |
| Immigrants | Hong Kong | 100.0 /100 | #8 | Exceptional $56,709 |
| Immigrants | Ireland | 100.0 /100 | #9 | Exceptional $56,584 |
| Okinawans | 100.0 /100 | #10 | Exceptional $55,817 |
| Eastern Europeans | 100.0 /100 | #11 | Exceptional $55,780 |
| Immigrants | Sweden | 100.0 /100 | #12 | Exceptional $55,582 |
| Immigrants | India | 100.0 /100 | #13 | Exceptional $55,268 |
| Immigrants | Belgium | 100.0 /100 | #14 | Exceptional $55,082 |
| Cypriots | 100.0 /100 | #15 | Exceptional $54,899 |
| Immigrants | Switzerland | 100.0 /100 | #16 | Exceptional $54,866 |
| Immigrants | France | 100.0 /100 | #17 | Exceptional $54,557 |
| Thais | 100.0 /100 | #18 | Exceptional $54,307 |