Danish vs Immigrants from St. Vincent and the Grenadines Median Male Earnings
COMPARE
Danish
Immigrants from St. Vincent and the Grenadines
Median Male Earnings
Median Male Earnings Comparison
Danes
Immigrants from St. Vincent and the Grenadines
$56,246
MEDIAN MALE EARNINGS
84.8/ 100
METRIC RATING
141st/ 347
METRIC RANK
$50,665
MEDIAN MALE EARNINGS
2.3/ 100
METRIC RATING
241st/ 347
METRIC RANK
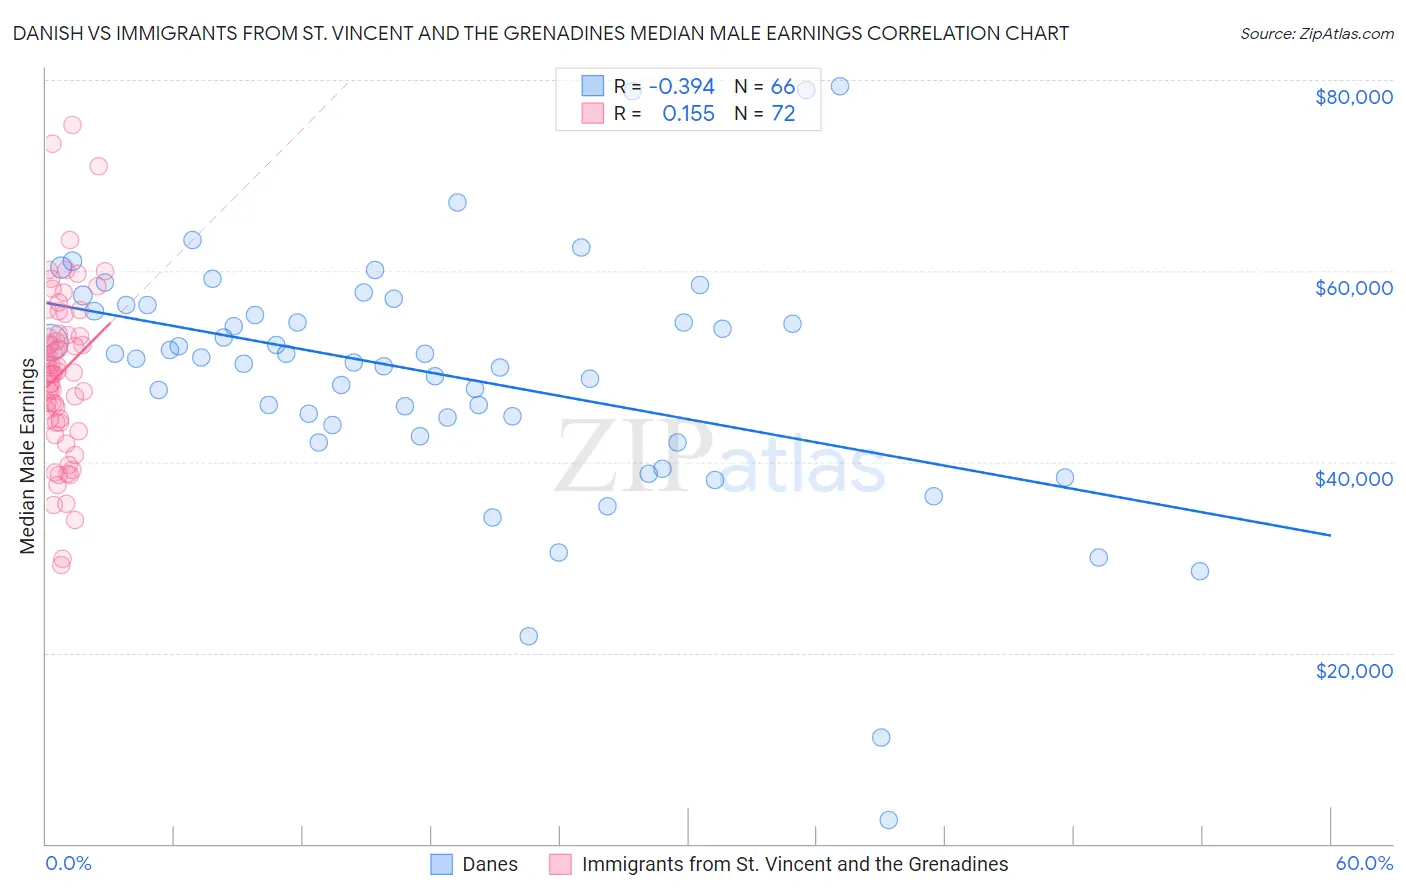
Danish vs Immigrants from St. Vincent and the Grenadines Median Male Earnings Correlation Chart
The statistical analysis conducted on geographies consisting of 473,826,770 people shows a mild negative correlation between the proportion of Danes and median male earnings in the United States with a correlation coefficient (R) of -0.394 and weighted average of $56,246. Similarly, the statistical analysis conducted on geographies consisting of 56,194,300 people shows a poor positive correlation between the proportion of Immigrants from St. Vincent and the Grenadines and median male earnings in the United States with a correlation coefficient (R) of 0.155 and weighted average of $50,665, a difference of 11.0%.
Median Male Earnings Correlation Summary
| Measurement | Danish | Immigrants from St. Vincent and the Grenadines |
| Minimum | $2,499 | $29,197 |
| Maximum | $79,323 | $75,304 |
| Range | $76,824 | $46,107 |
| Mean | $49,129 | $49,395 |
| Median | $50,861 | $49,325 |
| Interquartile 25% (IQ1) | $43,822 | $44,224 |
| Interquartile 75% (IQ3) | $56,381 | $53,330 |
| Interquartile Range (IQR) | $12,560 | $9,107 |
| Standard Deviation (Sample) | $13,278 | $8,903 |
| Standard Deviation (Population) | $13,177 | $8,841 |
Similar Demographics by Median Male Earnings
Demographics Similar to Danes by Median Male Earnings
In terms of median male earnings, the demographic groups most similar to Danes are Ethiopian ($56,243, a difference of 0.0%), Zimbabwean ($56,302, a difference of 0.10%), Luxembourger ($56,300, a difference of 0.10%), Slovak ($56,306, a difference of 0.11%), and Sri Lankan ($56,136, a difference of 0.19%).
| Demographics | Rating | Rank | Median Male Earnings |
| Moroccans | 87.7 /100 | #134 | Excellent $56,499 |
| Irish | 87.4 /100 | #135 | Excellent $56,464 |
| Immigrants | Saudi Arabia | 87.2 /100 | #136 | Excellent $56,452 |
| Slavs | 86.5 /100 | #137 | Excellent $56,390 |
| Slovaks | 85.5 /100 | #138 | Excellent $56,306 |
| Zimbabweans | 85.5 /100 | #139 | Excellent $56,302 |
| Luxembourgers | 85.5 /100 | #140 | Excellent $56,300 |
| Danes | 84.8 /100 | #141 | Excellent $56,246 |
| Ethiopians | 84.8 /100 | #142 | Excellent $56,243 |
| Sri Lankans | 83.4 /100 | #143 | Excellent $56,136 |
| Immigrants | Uganda | 82.4 /100 | #144 | Excellent $56,064 |
| Norwegians | 80.9 /100 | #145 | Excellent $55,965 |
| Immigrants | Chile | 80.7 /100 | #146 | Excellent $55,954 |
| Immigrants | Philippines | 78.4 /100 | #147 | Good $55,809 |
| Scottish | 78.2 /100 | #148 | Good $55,793 |
Demographics Similar to Immigrants from St. Vincent and the Grenadines by Median Male Earnings
In terms of median male earnings, the demographic groups most similar to Immigrants from St. Vincent and the Grenadines are West Indian ($50,682, a difference of 0.030%), Guyanese ($50,613, a difference of 0.10%), French American Indian ($50,611, a difference of 0.11%), American ($50,761, a difference of 0.19%), and Malaysian ($50,772, a difference of 0.21%).
| Demographics | Rating | Rank | Median Male Earnings |
| Cape Verdeans | 3.5 /100 | #234 | Tragic $51,103 |
| Immigrants | Western Africa | 3.0 /100 | #235 | Tragic $50,940 |
| Pennsylvania Germans | 2.8 /100 | #236 | Tragic $50,878 |
| Immigrants | Barbados | 2.6 /100 | #237 | Tragic $50,795 |
| Malaysians | 2.5 /100 | #238 | Tragic $50,772 |
| Americans | 2.5 /100 | #239 | Tragic $50,761 |
| West Indians | 2.3 /100 | #240 | Tragic $50,682 |
| Immigrants | St. Vincent and the Grenadines | 2.3 /100 | #241 | Tragic $50,665 |
| Guyanese | 2.2 /100 | #242 | Tragic $50,613 |
| French American Indians | 2.2 /100 | #243 | Tragic $50,611 |
| Houma | 2.0 /100 | #244 | Tragic $50,547 |
| Hawaiians | 1.9 /100 | #245 | Tragic $50,488 |
| Immigrants | Ecuador | 1.9 /100 | #246 | Tragic $50,474 |
| Sub-Saharan Africans | 1.8 /100 | #247 | Tragic $50,408 |
| Immigrants | Guyana | 1.6 /100 | #248 | Tragic $50,321 |