Danish vs Houma Median Male Earnings
COMPARE
Danish
Houma
Median Male Earnings
Median Male Earnings Comparison
Danes
Houma
$56,246
MEDIAN MALE EARNINGS
84.8/ 100
METRIC RATING
141st/ 347
METRIC RANK
$50,547
MEDIAN MALE EARNINGS
2.0/ 100
METRIC RATING
244th/ 347
METRIC RANK
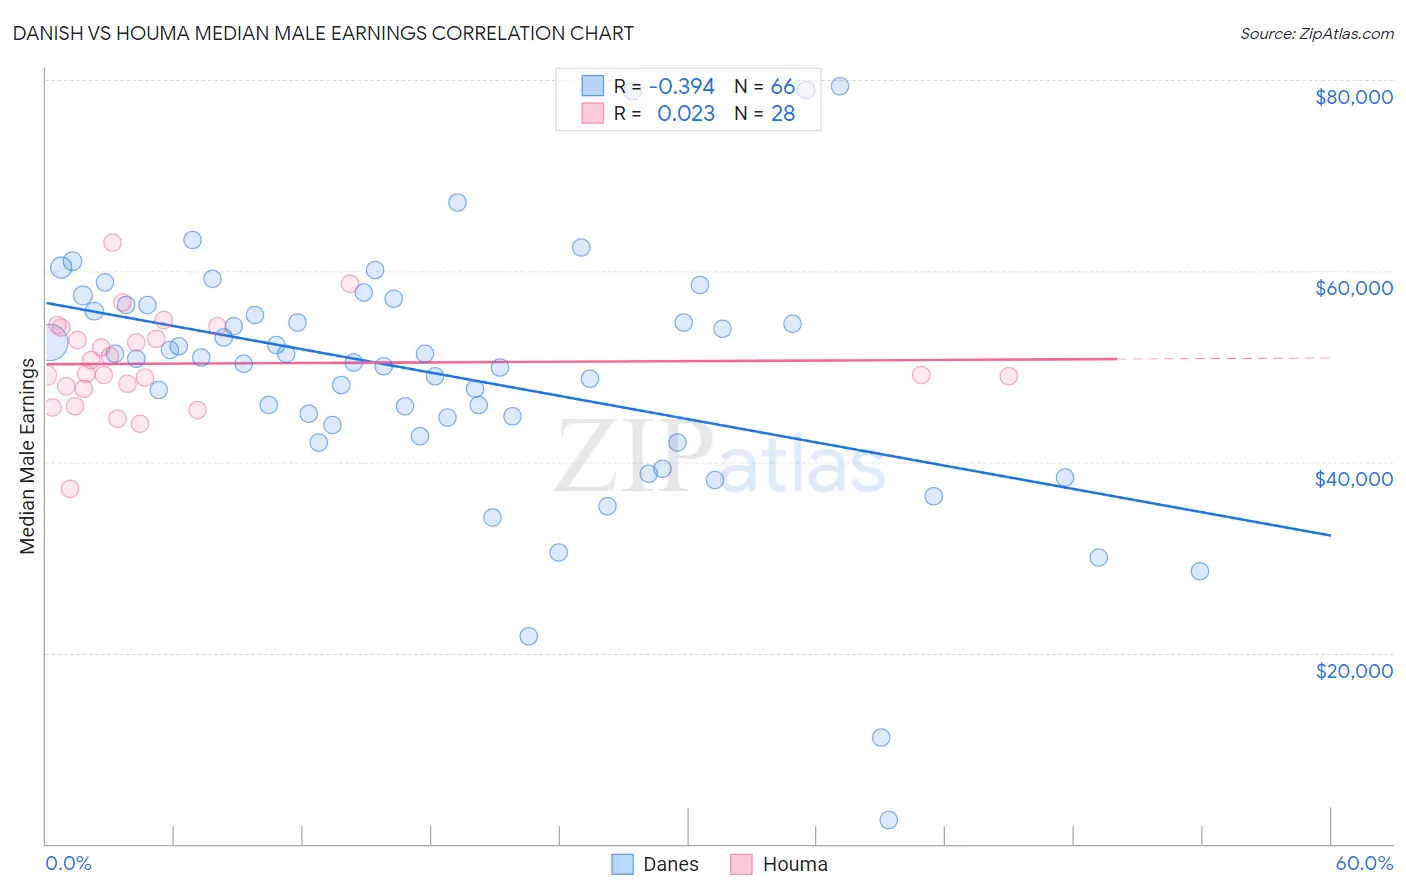
Danish vs Houma Median Male Earnings Correlation Chart
The statistical analysis conducted on geographies consisting of 473,826,770 people shows a mild negative correlation between the proportion of Danes and median male earnings in the United States with a correlation coefficient (R) of -0.394 and weighted average of $56,246. Similarly, the statistical analysis conducted on geographies consisting of 36,794,653 people shows no correlation between the proportion of Houma and median male earnings in the United States with a correlation coefficient (R) of 0.023 and weighted average of $50,547, a difference of 11.3%.
Median Male Earnings Correlation Summary
| Measurement | Danish | Houma |
| Minimum | $2,499 | $37,208 |
| Maximum | $79,323 | $62,981 |
| Range | $76,824 | $25,773 |
| Mean | $49,129 | $50,295 |
| Median | $50,861 | $49,219 |
| Interquartile 25% (IQ1) | $43,822 | $47,813 |
| Interquartile 75% (IQ3) | $56,381 | $53,443 |
| Interquartile Range (IQR) | $12,560 | $5,630 |
| Standard Deviation (Sample) | $13,278 | $5,065 |
| Standard Deviation (Population) | $13,177 | $4,974 |
Similar Demographics by Median Male Earnings
Demographics Similar to Danes by Median Male Earnings
In terms of median male earnings, the demographic groups most similar to Danes are Ethiopian ($56,243, a difference of 0.0%), Zimbabwean ($56,302, a difference of 0.10%), Luxembourger ($56,300, a difference of 0.10%), Slovak ($56,306, a difference of 0.11%), and Sri Lankan ($56,136, a difference of 0.19%).
| Demographics | Rating | Rank | Median Male Earnings |
| Moroccans | 87.7 /100 | #134 | Excellent $56,499 |
| Irish | 87.4 /100 | #135 | Excellent $56,464 |
| Immigrants | Saudi Arabia | 87.2 /100 | #136 | Excellent $56,452 |
| Slavs | 86.5 /100 | #137 | Excellent $56,390 |
| Slovaks | 85.5 /100 | #138 | Excellent $56,306 |
| Zimbabweans | 85.5 /100 | #139 | Excellent $56,302 |
| Luxembourgers | 85.5 /100 | #140 | Excellent $56,300 |
| Danes | 84.8 /100 | #141 | Excellent $56,246 |
| Ethiopians | 84.8 /100 | #142 | Excellent $56,243 |
| Sri Lankans | 83.4 /100 | #143 | Excellent $56,136 |
| Immigrants | Uganda | 82.4 /100 | #144 | Excellent $56,064 |
| Norwegians | 80.9 /100 | #145 | Excellent $55,965 |
| Immigrants | Chile | 80.7 /100 | #146 | Excellent $55,954 |
| Immigrants | Philippines | 78.4 /100 | #147 | Good $55,809 |
| Scottish | 78.2 /100 | #148 | Good $55,793 |
Demographics Similar to Houma by Median Male Earnings
In terms of median male earnings, the demographic groups most similar to Houma are Hawaiian ($50,488, a difference of 0.12%), Guyanese ($50,613, a difference of 0.13%), French American Indian ($50,611, a difference of 0.13%), Immigrants from Ecuador ($50,474, a difference of 0.14%), and Immigrants from St. Vincent and the Grenadines ($50,665, a difference of 0.23%).
| Demographics | Rating | Rank | Median Male Earnings |
| Immigrants | Barbados | 2.6 /100 | #237 | Tragic $50,795 |
| Malaysians | 2.5 /100 | #238 | Tragic $50,772 |
| Americans | 2.5 /100 | #239 | Tragic $50,761 |
| West Indians | 2.3 /100 | #240 | Tragic $50,682 |
| Immigrants | St. Vincent and the Grenadines | 2.3 /100 | #241 | Tragic $50,665 |
| Guyanese | 2.2 /100 | #242 | Tragic $50,613 |
| French American Indians | 2.2 /100 | #243 | Tragic $50,611 |
| Houma | 2.0 /100 | #244 | Tragic $50,547 |
| Hawaiians | 1.9 /100 | #245 | Tragic $50,488 |
| Immigrants | Ecuador | 1.9 /100 | #246 | Tragic $50,474 |
| Sub-Saharan Africans | 1.8 /100 | #247 | Tragic $50,408 |
| Immigrants | Guyana | 1.6 /100 | #248 | Tragic $50,321 |
| Immigrants | Burma/Myanmar | 1.6 /100 | #249 | Tragic $50,298 |
| Osage | 1.6 /100 | #250 | Tragic $50,292 |
| Immigrants | Grenada | 1.6 /100 | #251 | Tragic $50,279 |