Danish vs Tongan GED/Equivalency
COMPARE
Danish
Tongan
GED/Equivalency
GED/Equivalency Comparison
Danes
Tongans
88.4%
GED/EQUIVALENCY
99.8/ 100
METRIC RATING
32nd/ 347
METRIC RANK
85.2%
GED/EQUIVALENCY
20.7/ 100
METRIC RATING
196th/ 347
METRIC RANK
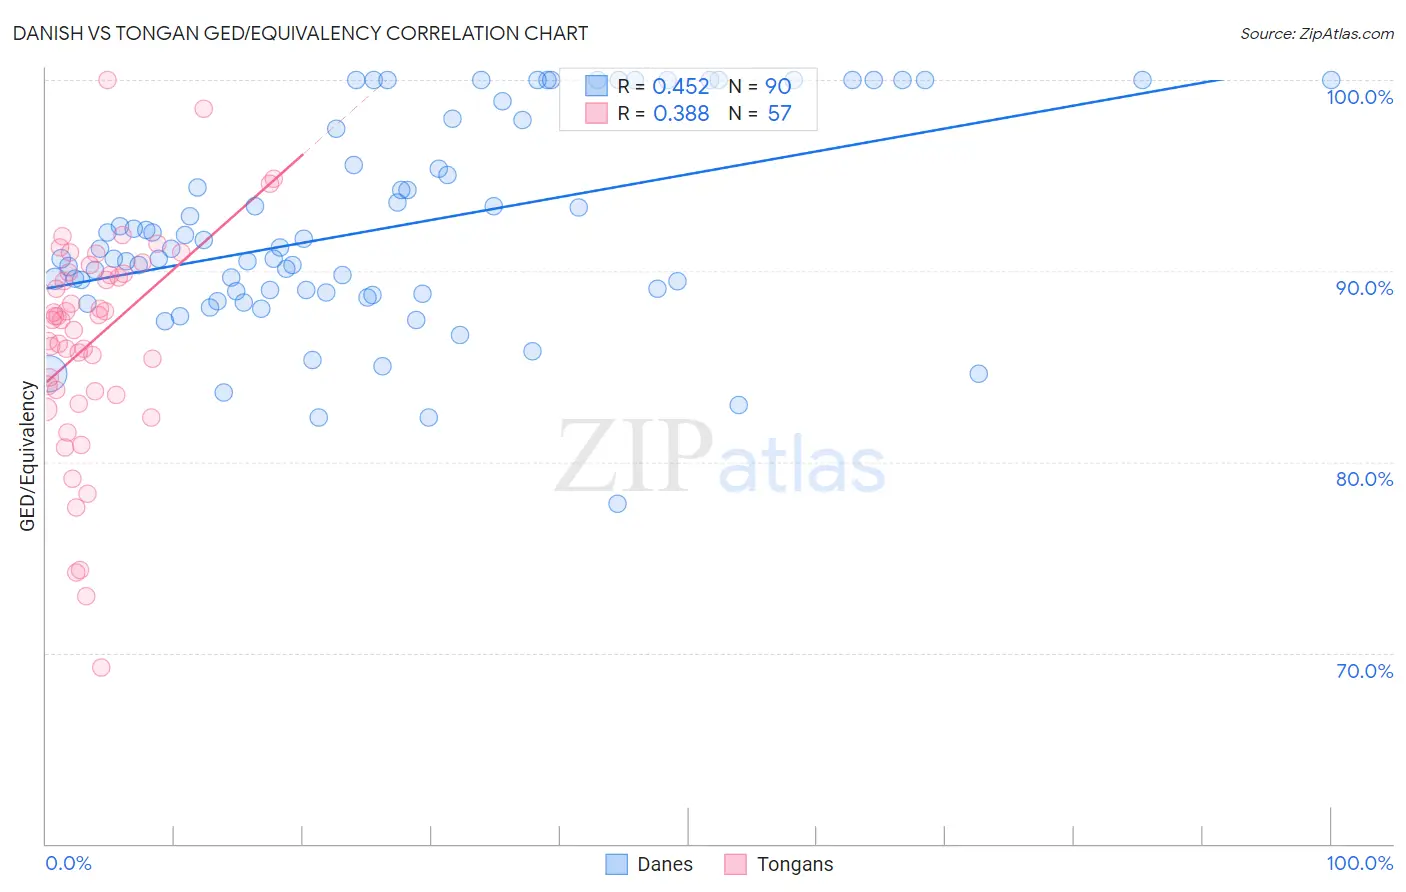
Danish vs Tongan GED/Equivalency Correlation Chart
The statistical analysis conducted on geographies consisting of 474,193,540 people shows a moderate positive correlation between the proportion of Danes and percentage of population with at least ged/equivalency education in the United States with a correlation coefficient (R) of 0.452 and weighted average of 88.4%. Similarly, the statistical analysis conducted on geographies consisting of 102,904,773 people shows a mild positive correlation between the proportion of Tongans and percentage of population with at least ged/equivalency education in the United States with a correlation coefficient (R) of 0.388 and weighted average of 85.2%, a difference of 3.8%.
GED/Equivalency Correlation Summary
| Measurement | Danish | Tongan |
| Minimum | 77.8% | 69.2% |
| Maximum | 100.0% | 100.0% |
| Range | 22.2% | 30.8% |
| Mean | 92.3% | 86.4% |
| Median | 91.2% | 87.4% |
| Interquartile 25% (IQ1) | 88.9% | 83.6% |
| Interquartile 75% (IQ3) | 97.9% | 89.9% |
| Interquartile Range (IQR) | 9.0% | 6.3% |
| Standard Deviation (Sample) | 5.4% | 5.8% |
| Standard Deviation (Population) | 5.3% | 5.8% |
Similar Demographics by GED/Equivalency
Demographics Similar to Danes by GED/Equivalency
In terms of ged/equivalency, the demographic groups most similar to Danes are Bhutanese (88.4%, a difference of 0.020%), Immigrants from Sweden (88.4%, a difference of 0.040%), Turkish (88.5%, a difference of 0.050%), Immigrants from Japan (88.4%, a difference of 0.050%), and Immigrants from South Central Asia (88.4%, a difference of 0.060%).
| Demographics | Rating | Rank | GED/Equivalency |
| Estonians | 99.8 /100 | #25 | Exceptional 88.6% |
| Immigrants | Australia | 99.8 /100 | #26 | Exceptional 88.6% |
| Immigrants | Lithuania | 99.8 /100 | #27 | Exceptional 88.6% |
| Immigrants | Northern Europe | 99.8 /100 | #28 | Exceptional 88.5% |
| Poles | 99.8 /100 | #29 | Exceptional 88.5% |
| Turks | 99.8 /100 | #30 | Exceptional 88.5% |
| Bhutanese | 99.8 /100 | #31 | Exceptional 88.4% |
| Danes | 99.8 /100 | #32 | Exceptional 88.4% |
| Immigrants | Sweden | 99.7 /100 | #33 | Exceptional 88.4% |
| Immigrants | Japan | 99.7 /100 | #34 | Exceptional 88.4% |
| Immigrants | South Central Asia | 99.7 /100 | #35 | Exceptional 88.4% |
| Immigrants | Belgium | 99.7 /100 | #36 | Exceptional 88.3% |
| Immigrants | Austria | 99.7 /100 | #37 | Exceptional 88.3% |
| Burmese | 99.7 /100 | #38 | Exceptional 88.3% |
| Immigrants | Israel | 99.6 /100 | #39 | Exceptional 88.2% |
Demographics Similar to Tongans by GED/Equivalency
In terms of ged/equivalency, the demographic groups most similar to Tongans are Puget Sound Salish (85.2%, a difference of 0.0%), Chippewa (85.2%, a difference of 0.0%), Costa Rican (85.2%, a difference of 0.010%), Delaware (85.2%, a difference of 0.050%), and South American Indian (85.2%, a difference of 0.060%).
| Demographics | Rating | Rank | GED/Equivalency |
| Guamanians/Chamorros | 28.4 /100 | #189 | Fair 85.3% |
| Alaskan Athabascans | 27.5 /100 | #190 | Fair 85.3% |
| South American Indians | 22.8 /100 | #191 | Fair 85.2% |
| Immigrants | Nonimmigrants | 22.7 /100 | #192 | Fair 85.2% |
| Delaware | 22.2 /100 | #193 | Fair 85.2% |
| Puget Sound Salish | 20.8 /100 | #194 | Fair 85.2% |
| Chippewa | 20.8 /100 | #195 | Fair 85.2% |
| Tongans | 20.7 /100 | #196 | Fair 85.2% |
| Costa Ricans | 20.4 /100 | #197 | Fair 85.2% |
| Immigrants | Africa | 17.5 /100 | #198 | Poor 85.1% |
| Somalis | 16.4 /100 | #199 | Poor 85.0% |
| Uruguayans | 16.0 /100 | #200 | Poor 85.0% |
| Portuguese | 15.9 /100 | #201 | Poor 85.0% |
| Cree | 15.9 /100 | #202 | Poor 85.0% |
| Panamanians | 15.3 /100 | #203 | Poor 85.0% |