Danish vs Indonesian Median Household Income
COMPARE
Danish
Indonesian
Median Household Income
Median Household Income Comparison
Danes
Indonesians
$87,676
MEDIAN HOUSEHOLD INCOME
83.9/ 100
METRIC RATING
143rd/ 347
METRIC RANK
$72,856
MEDIAN HOUSEHOLD INCOME
0.0/ 100
METRIC RATING
299th/ 347
METRIC RANK
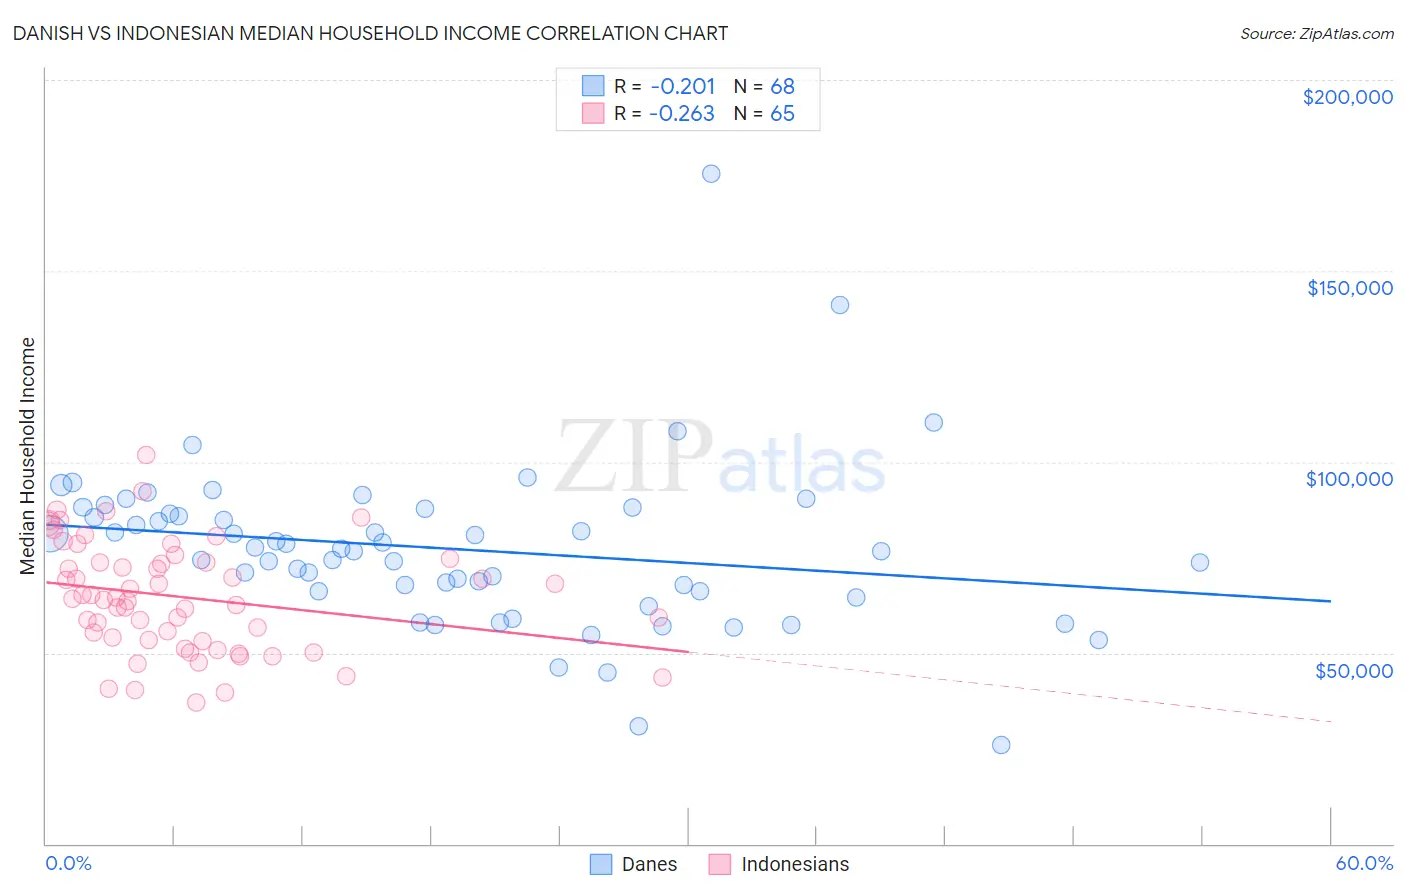
Danish vs Indonesian Median Household Income Correlation Chart
The statistical analysis conducted on geographies consisting of 473,742,440 people shows a weak negative correlation between the proportion of Danes and median household income in the United States with a correlation coefficient (R) of -0.201 and weighted average of $87,676. Similarly, the statistical analysis conducted on geographies consisting of 162,609,195 people shows a weak negative correlation between the proportion of Indonesians and median household income in the United States with a correlation coefficient (R) of -0.263 and weighted average of $72,856, a difference of 20.3%.
Median Household Income Correlation Summary
| Measurement | Danish | Indonesian |
| Minimum | $25,809 | $36,966 |
| Maximum | $175,595 | $101,767 |
| Range | $149,786 | $64,801 |
| Mean | $77,182 | $64,599 |
| Median | $76,890 | $64,081 |
| Interquartile 25% (IQ1) | $66,124 | $53,194 |
| Interquartile 75% (IQ3) | $87,030 | $74,214 |
| Interquartile Range (IQR) | $20,907 | $21,021 |
| Standard Deviation (Sample) | $21,727 | $14,432 |
| Standard Deviation (Population) | $21,566 | $14,321 |
Similar Demographics by Median Household Income
Demographics Similar to Danes by Median Household Income
In terms of median household income, the demographic groups most similar to Danes are Canadian ($87,769, a difference of 0.11%), Serbian ($87,572, a difference of 0.12%), Ugandan ($87,557, a difference of 0.14%), Immigrants from Uganda ($87,553, a difference of 0.14%), and South American Indian ($87,446, a difference of 0.26%).
| Demographics | Rating | Rank | Median Household Income |
| Poles | 89.7 /100 | #136 | Excellent $88,472 |
| Sierra Leoneans | 89.6 /100 | #137 | Excellent $88,463 |
| Arabs | 89.2 /100 | #138 | Excellent $88,398 |
| Immigrants | Chile | 89.2 /100 | #139 | Excellent $88,388 |
| Lebanese | 87.2 /100 | #140 | Excellent $88,091 |
| Immigrants | Morocco | 86.0 /100 | #141 | Excellent $87,930 |
| Canadians | 84.7 /100 | #142 | Excellent $87,769 |
| Danes | 83.9 /100 | #143 | Excellent $87,676 |
| Serbians | 83.0 /100 | #144 | Excellent $87,572 |
| Ugandans | 82.9 /100 | #145 | Excellent $87,557 |
| Immigrants | Uganda | 82.8 /100 | #146 | Excellent $87,553 |
| South American Indians | 81.8 /100 | #147 | Excellent $87,446 |
| Costa Ricans | 80.0 /100 | #148 | Excellent $87,262 |
| Immigrants | Nepal | 77.7 /100 | #149 | Good $87,046 |
| Basques | 77.2 /100 | #150 | Good $87,001 |
Demographics Similar to Indonesians by Median Household Income
In terms of median household income, the demographic groups most similar to Indonesians are Immigrants from Dominica ($72,760, a difference of 0.13%), Paiute ($72,959, a difference of 0.14%), Cherokee ($72,682, a difference of 0.24%), Shoshone ($72,660, a difference of 0.27%), and African ($72,650, a difference of 0.28%).
| Demographics | Rating | Rank | Median Household Income |
| Comanche | 0.1 /100 | #292 | Tragic $73,747 |
| Immigrants | Cabo Verde | 0.1 /100 | #293 | Tragic $73,515 |
| Blackfeet | 0.1 /100 | #294 | Tragic $73,509 |
| Cubans | 0.1 /100 | #295 | Tragic $73,392 |
| Haitians | 0.1 /100 | #296 | Tragic $73,306 |
| Immigrants | Mexico | 0.0 /100 | #297 | Tragic $73,160 |
| Paiute | 0.0 /100 | #298 | Tragic $72,959 |
| Indonesians | 0.0 /100 | #299 | Tragic $72,856 |
| Immigrants | Dominica | 0.0 /100 | #300 | Tragic $72,760 |
| Cherokee | 0.0 /100 | #301 | Tragic $72,682 |
| Shoshone | 0.0 /100 | #302 | Tragic $72,660 |
| Africans | 0.0 /100 | #303 | Tragic $72,650 |
| Immigrants | Haiti | 0.0 /100 | #304 | Tragic $72,599 |
| Hondurans | 0.0 /100 | #305 | Tragic $72,588 |
| Potawatomi | 0.0 /100 | #306 | Tragic $72,576 |