Danish vs Pakistani Median Household Income
COMPARE
Danish
Pakistani
Median Household Income
Median Household Income Comparison
Danes
Pakistanis
$87,676
MEDIAN HOUSEHOLD INCOME
83.9/ 100
METRIC RATING
143rd/ 347
METRIC RANK
$89,638
MEDIAN HOUSEHOLD INCOME
94.8/ 100
METRIC RATING
122nd/ 347
METRIC RANK
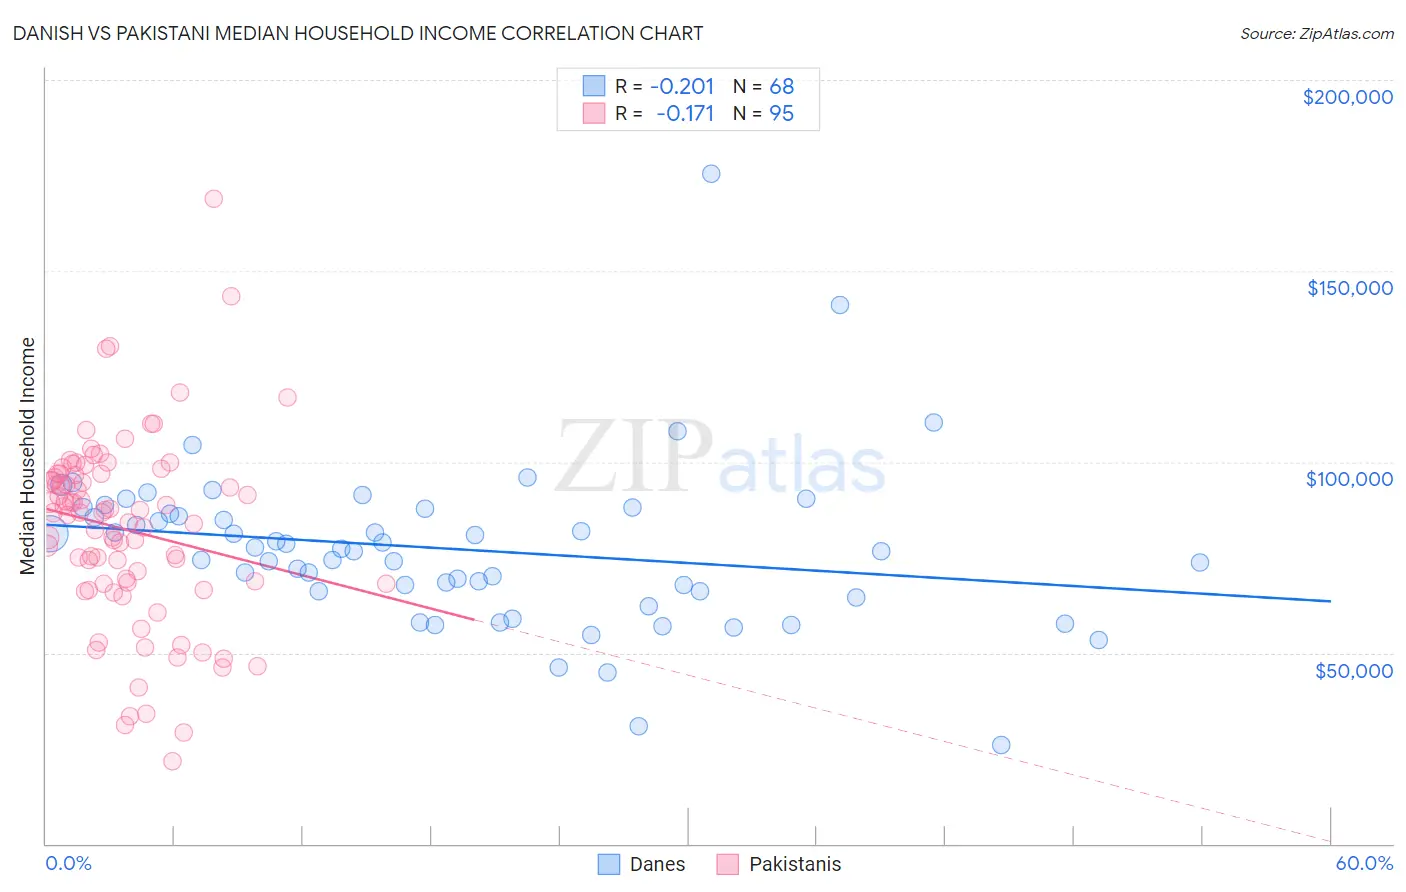
Danish vs Pakistani Median Household Income Correlation Chart
The statistical analysis conducted on geographies consisting of 473,742,440 people shows a weak negative correlation between the proportion of Danes and median household income in the United States with a correlation coefficient (R) of -0.201 and weighted average of $87,676. Similarly, the statistical analysis conducted on geographies consisting of 335,154,769 people shows a poor negative correlation between the proportion of Pakistanis and median household income in the United States with a correlation coefficient (R) of -0.171 and weighted average of $89,638, a difference of 2.2%.
Median Household Income Correlation Summary
| Measurement | Danish | Pakistani |
| Minimum | $25,809 | $21,500 |
| Maximum | $175,595 | $169,063 |
| Range | $149,786 | $147,563 |
| Mean | $77,182 | $82,388 |
| Median | $76,890 | $86,853 |
| Interquartile 25% (IQ1) | $66,124 | $68,125 |
| Interquartile 75% (IQ3) | $87,030 | $96,894 |
| Interquartile Range (IQR) | $20,907 | $28,769 |
| Standard Deviation (Sample) | $21,727 | $24,553 |
| Standard Deviation (Population) | $21,566 | $24,423 |
Similar Demographics by Median Household Income
Demographics Similar to Danes by Median Household Income
In terms of median household income, the demographic groups most similar to Danes are Canadian ($87,769, a difference of 0.11%), Serbian ($87,572, a difference of 0.12%), Ugandan ($87,557, a difference of 0.14%), Immigrants from Uganda ($87,553, a difference of 0.14%), and South American Indian ($87,446, a difference of 0.26%).
| Demographics | Rating | Rank | Median Household Income |
| Poles | 89.7 /100 | #136 | Excellent $88,472 |
| Sierra Leoneans | 89.6 /100 | #137 | Excellent $88,463 |
| Arabs | 89.2 /100 | #138 | Excellent $88,398 |
| Immigrants | Chile | 89.2 /100 | #139 | Excellent $88,388 |
| Lebanese | 87.2 /100 | #140 | Excellent $88,091 |
| Immigrants | Morocco | 86.0 /100 | #141 | Excellent $87,930 |
| Canadians | 84.7 /100 | #142 | Excellent $87,769 |
| Danes | 83.9 /100 | #143 | Excellent $87,676 |
| Serbians | 83.0 /100 | #144 | Excellent $87,572 |
| Ugandans | 82.9 /100 | #145 | Excellent $87,557 |
| Immigrants | Uganda | 82.8 /100 | #146 | Excellent $87,553 |
| South American Indians | 81.8 /100 | #147 | Excellent $87,446 |
| Costa Ricans | 80.0 /100 | #148 | Excellent $87,262 |
| Immigrants | Nepal | 77.7 /100 | #149 | Good $87,046 |
| Basques | 77.2 /100 | #150 | Good $87,001 |
Demographics Similar to Pakistanis by Median Household Income
In terms of median household income, the demographic groups most similar to Pakistanis are Ethiopian ($89,640, a difference of 0.0%), Immigrants from North Macedonia ($89,741, a difference of 0.11%), Albanian ($89,744, a difference of 0.12%), Immigrants from Zimbabwe ($89,496, a difference of 0.16%), and Syrian ($89,830, a difference of 0.21%).
| Demographics | Rating | Rank | Median Household Income |
| Immigrants | Western Asia | 95.9 /100 | #115 | Exceptional $90,005 |
| Native Hawaiians | 95.7 /100 | #116 | Exceptional $89,919 |
| Taiwanese | 95.6 /100 | #117 | Exceptional $89,900 |
| Syrians | 95.4 /100 | #118 | Exceptional $89,830 |
| Albanians | 95.2 /100 | #119 | Exceptional $89,744 |
| Immigrants | North Macedonia | 95.2 /100 | #120 | Exceptional $89,741 |
| Ethiopians | 94.9 /100 | #121 | Exceptional $89,640 |
| Pakistanis | 94.8 /100 | #122 | Exceptional $89,638 |
| Immigrants | Zimbabwe | 94.4 /100 | #123 | Exceptional $89,496 |
| Immigrants | Jordan | 94.1 /100 | #124 | Exceptional $89,412 |
| Immigrants | Kuwait | 93.5 /100 | #125 | Exceptional $89,263 |
| Immigrants | Oceania | 92.9 /100 | #126 | Exceptional $89,100 |
| Immigrants | Peru | 92.5 /100 | #127 | Exceptional $89,010 |
| Portuguese | 92.3 /100 | #128 | Exceptional $88,976 |
| Brazilians | 92.1 /100 | #129 | Exceptional $88,934 |