Danish vs Colombian Median Household Income
COMPARE
Danish
Colombian
Median Household Income
Median Household Income Comparison
Danes
Colombians
$87,676
MEDIAN HOUSEHOLD INCOME
83.9/ 100
METRIC RATING
143rd/ 347
METRIC RANK
$85,716
MEDIAN HOUSEHOLD INCOME
59.7/ 100
METRIC RATING
169th/ 347
METRIC RANK
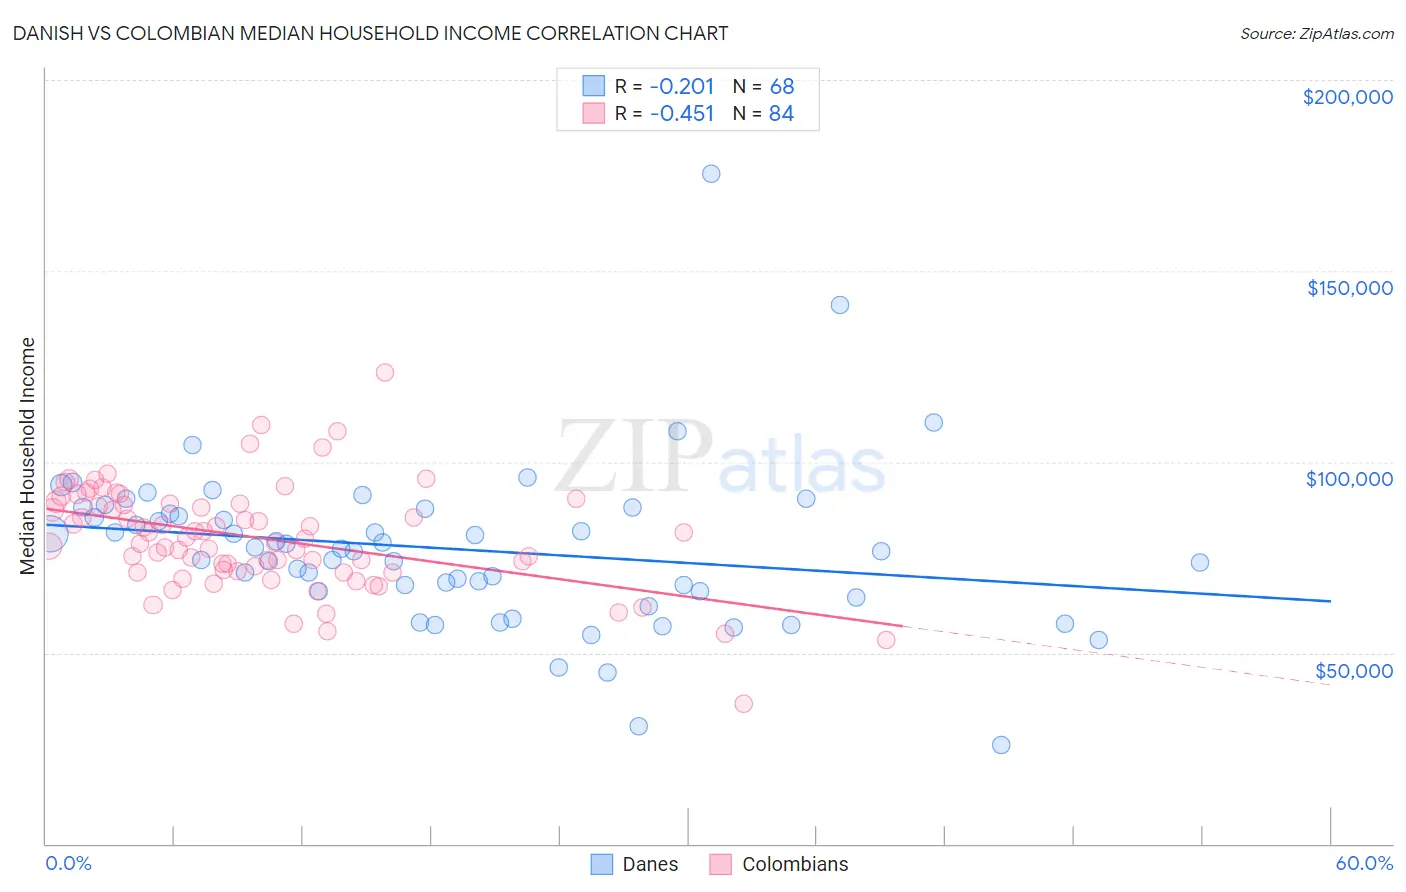
Danish vs Colombian Median Household Income Correlation Chart
The statistical analysis conducted on geographies consisting of 473,742,440 people shows a weak negative correlation between the proportion of Danes and median household income in the United States with a correlation coefficient (R) of -0.201 and weighted average of $87,676. Similarly, the statistical analysis conducted on geographies consisting of 419,147,971 people shows a moderate negative correlation between the proportion of Colombians and median household income in the United States with a correlation coefficient (R) of -0.451 and weighted average of $85,716, a difference of 2.3%.
Median Household Income Correlation Summary
| Measurement | Danish | Colombian |
| Minimum | $25,809 | $36,563 |
| Maximum | $175,595 | $123,534 |
| Range | $149,786 | $86,971 |
| Mean | $77,182 | $80,109 |
| Median | $76,890 | $80,054 |
| Interquartile 25% (IQ1) | $66,124 | $71,412 |
| Interquartile 75% (IQ3) | $87,030 | $89,021 |
| Interquartile Range (IQR) | $20,907 | $17,609 |
| Standard Deviation (Sample) | $21,727 | $13,777 |
| Standard Deviation (Population) | $21,566 | $13,694 |
Similar Demographics by Median Household Income
Demographics Similar to Danes by Median Household Income
In terms of median household income, the demographic groups most similar to Danes are Canadian ($87,769, a difference of 0.11%), Serbian ($87,572, a difference of 0.12%), Ugandan ($87,557, a difference of 0.14%), Immigrants from Uganda ($87,553, a difference of 0.14%), and South American Indian ($87,446, a difference of 0.26%).
| Demographics | Rating | Rank | Median Household Income |
| Poles | 89.7 /100 | #136 | Excellent $88,472 |
| Sierra Leoneans | 89.6 /100 | #137 | Excellent $88,463 |
| Arabs | 89.2 /100 | #138 | Excellent $88,398 |
| Immigrants | Chile | 89.2 /100 | #139 | Excellent $88,388 |
| Lebanese | 87.2 /100 | #140 | Excellent $88,091 |
| Immigrants | Morocco | 86.0 /100 | #141 | Excellent $87,930 |
| Canadians | 84.7 /100 | #142 | Excellent $87,769 |
| Danes | 83.9 /100 | #143 | Excellent $87,676 |
| Serbians | 83.0 /100 | #144 | Excellent $87,572 |
| Ugandans | 82.9 /100 | #145 | Excellent $87,557 |
| Immigrants | Uganda | 82.8 /100 | #146 | Excellent $87,553 |
| South American Indians | 81.8 /100 | #147 | Excellent $87,446 |
| Costa Ricans | 80.0 /100 | #148 | Excellent $87,262 |
| Immigrants | Nepal | 77.7 /100 | #149 | Good $87,046 |
| Basques | 77.2 /100 | #150 | Good $87,001 |
Demographics Similar to Colombians by Median Household Income
In terms of median household income, the demographic groups most similar to Colombians are Swiss ($85,681, a difference of 0.040%), Icelander ($85,797, a difference of 0.090%), Immigrants ($85,818, a difference of 0.12%), Immigrants from South America ($85,611, a difference of 0.12%), and Slovene ($85,562, a difference of 0.18%).
| Demographics | Rating | Rank | Median Household Income |
| Guamanians/Chamorros | 67.7 /100 | #162 | Good $86,255 |
| Czechs | 66.4 /100 | #163 | Good $86,164 |
| Irish | 66.2 /100 | #164 | Good $86,145 |
| Norwegians | 65.3 /100 | #165 | Good $86,084 |
| Scandinavians | 65.1 /100 | #166 | Good $86,073 |
| Immigrants | Immigrants | 61.3 /100 | #167 | Good $85,818 |
| Icelanders | 61.0 /100 | #168 | Good $85,797 |
| Colombians | 59.7 /100 | #169 | Average $85,716 |
| Swiss | 59.2 /100 | #170 | Average $85,681 |
| Immigrants | South America | 58.1 /100 | #171 | Average $85,611 |
| Slovenes | 57.4 /100 | #172 | Average $85,562 |
| Immigrants | Cameroon | 53.4 /100 | #173 | Average $85,314 |
| Scottish | 50.0 /100 | #174 | Average $85,101 |
| Immigrants | Costa Rica | 49.2 /100 | #175 | Average $85,054 |
| Alsatians | 49.2 /100 | #176 | Average $85,053 |