Czech vs Immigrants from Jordan Householder Income Ages 45 - 64 years
COMPARE
Czech
Immigrants from Jordan
Householder Income Ages 45 - 64 years
Householder Income Ages 45 - 64 years Comparison
Czechs
Immigrants from Jordan
$103,507
HOUSEHOLDER INCOME AGES 45 - 64 YEARS
83.1/ 100
METRIC RATING
144th/ 347
METRIC RANK
$106,164
HOUSEHOLDER INCOME AGES 45 - 64 YEARS
94.9/ 100
METRIC RATING
119th/ 347
METRIC RANK
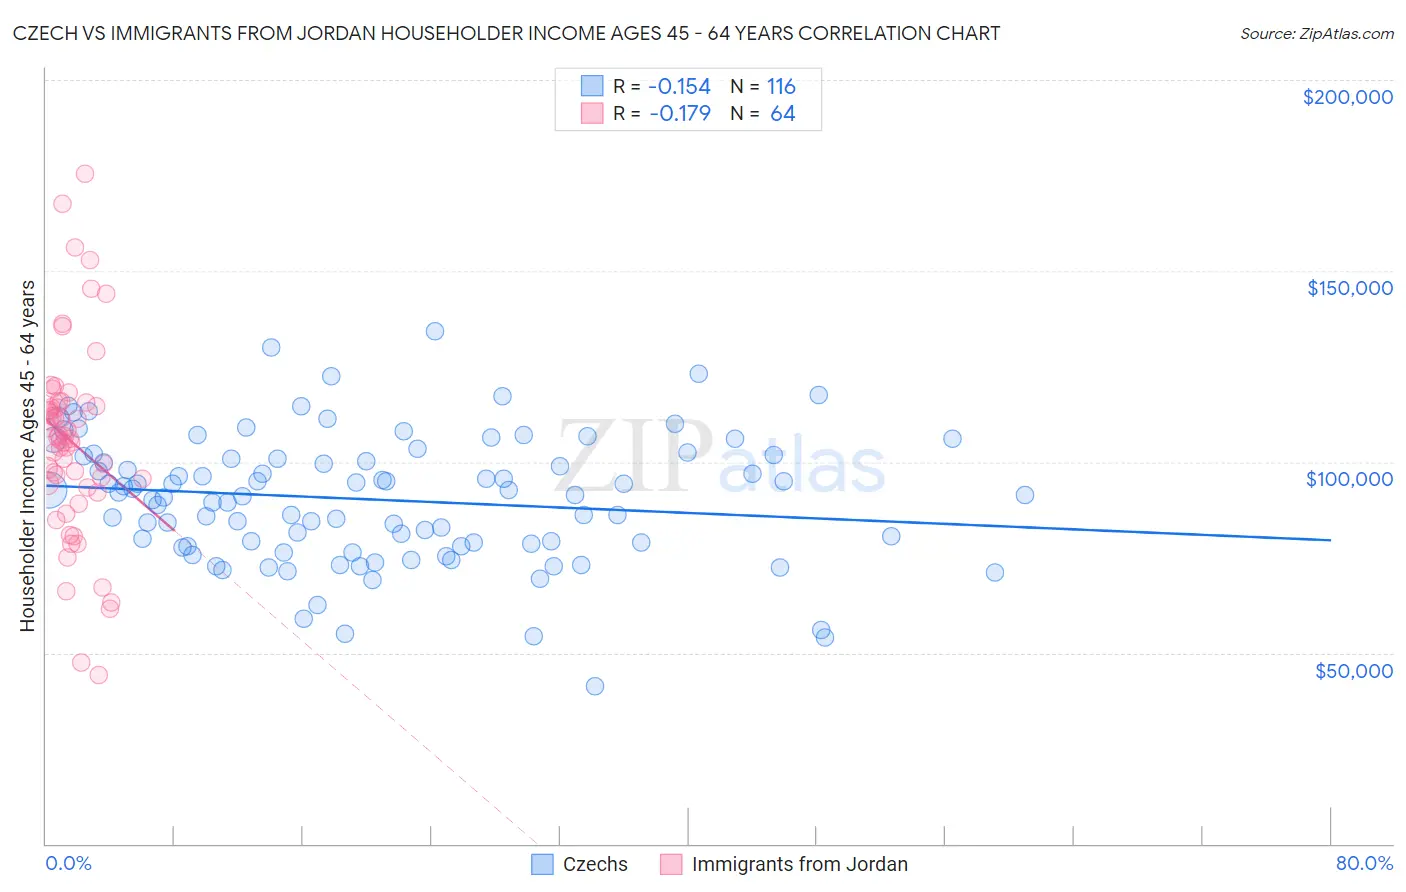
Czech vs Immigrants from Jordan Householder Income Ages 45 - 64 years Correlation Chart
The statistical analysis conducted on geographies consisting of 483,421,339 people shows a poor negative correlation between the proportion of Czechs and household income with householder between the ages 45 and 64 in the United States with a correlation coefficient (R) of -0.154 and weighted average of $103,507. Similarly, the statistical analysis conducted on geographies consisting of 181,177,214 people shows a poor negative correlation between the proportion of Immigrants from Jordan and household income with householder between the ages 45 and 64 in the United States with a correlation coefficient (R) of -0.179 and weighted average of $106,164, a difference of 2.6%.
Householder Income Ages 45 - 64 years Correlation Summary
| Measurement | Czech | Immigrants from Jordan |
| Minimum | $41,250 | $44,265 |
| Maximum | $134,167 | $175,361 |
| Range | $92,917 | $131,096 |
| Mean | $90,131 | $105,324 |
| Median | $91,354 | $106,275 |
| Interquartile 25% (IQ1) | $78,110 | $93,850 |
| Interquartile 75% (IQ3) | $101,246 | $114,914 |
| Interquartile Range (IQR) | $23,136 | $21,064 |
| Standard Deviation (Sample) | $16,799 | $25,270 |
| Standard Deviation (Population) | $16,726 | $25,072 |
Similar Demographics by Householder Income Ages 45 - 64 years
Demographics Similar to Czechs by Householder Income Ages 45 - 64 years
In terms of householder income ages 45 - 64 years, the demographic groups most similar to Czechs are Serbian ($103,522, a difference of 0.010%), Luxembourger ($103,536, a difference of 0.030%), Ugandan ($103,472, a difference of 0.030%), Immigrants from Uganda ($103,584, a difference of 0.070%), and Immigrants from Chile ($103,412, a difference of 0.090%).
| Demographics | Rating | Rank | Householder Income Ages 45 - 64 years |
| Hungarians | 85.8 /100 | #137 | Excellent $103,913 |
| Ethiopians | 84.7 /100 | #138 | Excellent $103,736 |
| Immigrants | Oceania | 84.5 /100 | #139 | Excellent $103,705 |
| Norwegians | 84.3 /100 | #140 | Excellent $103,682 |
| Immigrants | Uganda | 83.7 /100 | #141 | Excellent $103,584 |
| Luxembourgers | 83.3 /100 | #142 | Excellent $103,536 |
| Serbians | 83.2 /100 | #143 | Excellent $103,522 |
| Czechs | 83.1 /100 | #144 | Excellent $103,507 |
| Ugandans | 82.9 /100 | #145 | Excellent $103,472 |
| Immigrants | Chile | 82.5 /100 | #146 | Excellent $103,412 |
| Basques | 82.3 /100 | #147 | Excellent $103,387 |
| Immigrants | Germany | 81.5 /100 | #148 | Excellent $103,282 |
| Immigrants | Sierra Leone | 81.1 /100 | #149 | Excellent $103,227 |
| Immigrants | Peru | 80.7 /100 | #150 | Excellent $103,173 |
| Swiss | 79.9 /100 | #151 | Good $103,071 |
Demographics Similar to Immigrants from Jordan by Householder Income Ages 45 - 64 years
In terms of householder income ages 45 - 64 years, the demographic groups most similar to Immigrants from Jordan are Immigrants from Western Asia ($106,217, a difference of 0.050%), Immigrants from South Eastern Asia ($106,109, a difference of 0.050%), Albanian ($106,243, a difference of 0.070%), British ($106,264, a difference of 0.090%), and Immigrants from Kuwait ($106,285, a difference of 0.11%).
| Demographics | Rating | Rank | Householder Income Ages 45 - 64 years |
| Swedes | 95.4 /100 | #112 | Exceptional $106,377 |
| Europeans | 95.4 /100 | #113 | Exceptional $106,367 |
| Immigrants | Poland | 95.3 /100 | #114 | Exceptional $106,319 |
| Immigrants | Kuwait | 95.2 /100 | #115 | Exceptional $106,285 |
| British | 95.2 /100 | #116 | Exceptional $106,264 |
| Albanians | 95.1 /100 | #117 | Exceptional $106,243 |
| Immigrants | Western Asia | 95.0 /100 | #118 | Exceptional $106,217 |
| Immigrants | Jordan | 94.9 /100 | #119 | Exceptional $106,164 |
| Immigrants | South Eastern Asia | 94.8 /100 | #120 | Exceptional $106,109 |
| Poles | 94.4 /100 | #121 | Exceptional $105,952 |
| Immigrants | North Macedonia | 94.2 /100 | #122 | Exceptional $105,892 |
| Danes | 93.4 /100 | #123 | Exceptional $105,619 |
| Immigrants | Northern Africa | 92.8 /100 | #124 | Exceptional $105,430 |
| Pakistanis | 92.4 /100 | #125 | Exceptional $105,317 |
| Portuguese | 92.4 /100 | #126 | Exceptional $105,309 |