Czech vs Sioux Median Female Earnings
COMPARE
Czech
Sioux
Median Female Earnings
Median Female Earnings Comparison
Czechs
Sioux
$38,992
MEDIAN FEMALE EARNINGS
18.7/ 100
METRIC RATING
203rd/ 347
METRIC RANK
$35,063
MEDIAN FEMALE EARNINGS
0.0/ 100
METRIC RATING
307th/ 347
METRIC RANK
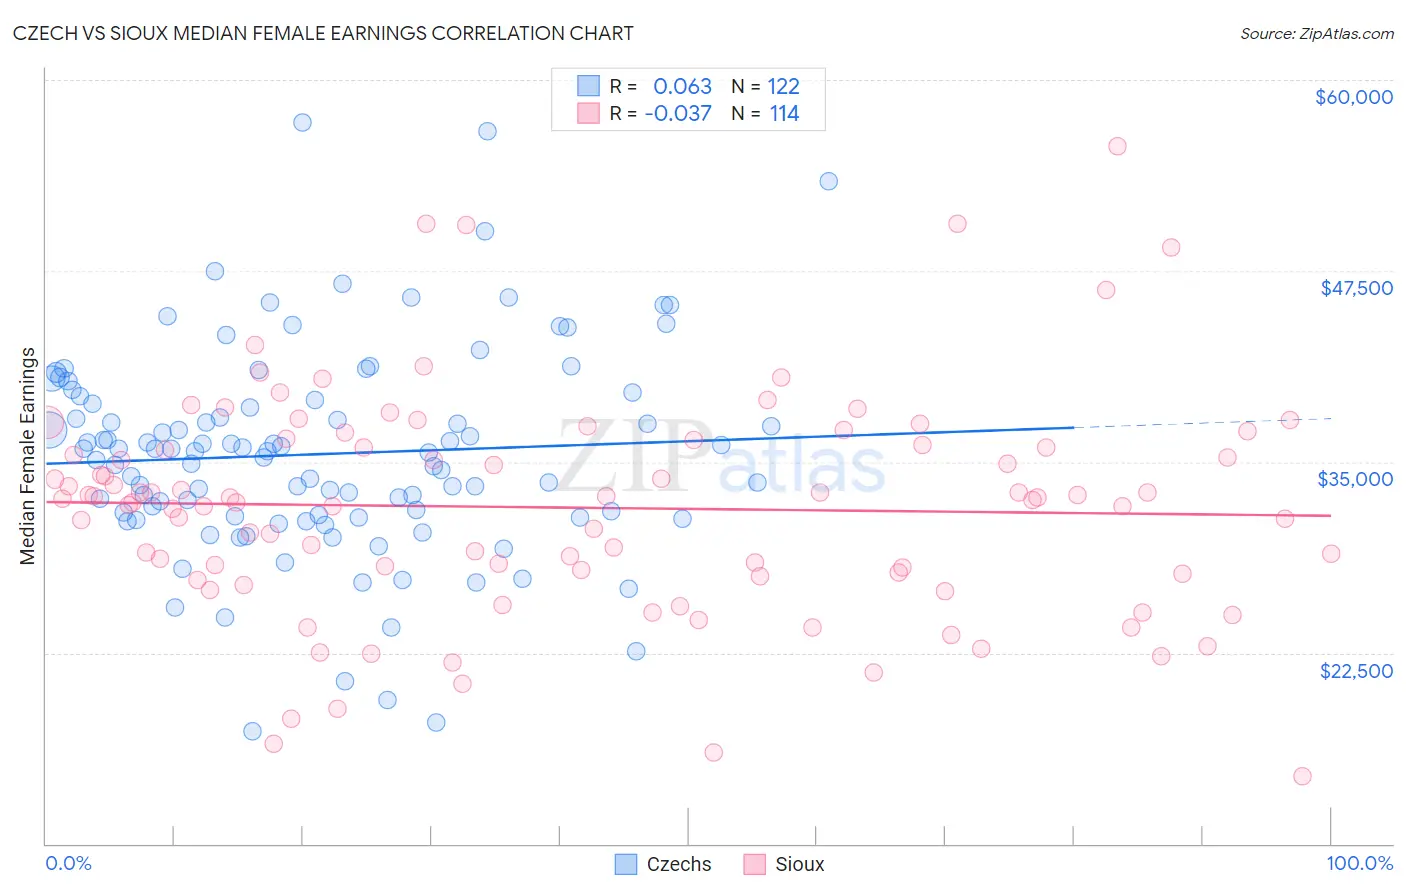
Czech vs Sioux Median Female Earnings Correlation Chart
The statistical analysis conducted on geographies consisting of 484,306,761 people shows a slight positive correlation between the proportion of Czechs and median female earnings in the United States with a correlation coefficient (R) of 0.063 and weighted average of $38,992. Similarly, the statistical analysis conducted on geographies consisting of 234,051,020 people shows no correlation between the proportion of Sioux and median female earnings in the United States with a correlation coefficient (R) of -0.037 and weighted average of $35,063, a difference of 11.2%.
Median Female Earnings Correlation Summary
| Measurement | Czech | Sioux |
| Minimum | $17,404 | $14,387 |
| Maximum | $57,188 | $55,625 |
| Range | $39,784 | $41,238 |
| Mean | $35,507 | $32,005 |
| Median | $35,690 | $32,537 |
| Interquartile 25% (IQ1) | $31,400 | $27,692 |
| Interquartile 75% (IQ3) | $39,083 | $36,094 |
| Interquartile Range (IQR) | $7,683 | $8,402 |
| Standard Deviation (Sample) | $6,872 | $7,319 |
| Standard Deviation (Population) | $6,843 | $7,287 |
Similar Demographics by Median Female Earnings
Demographics Similar to Czechs by Median Female Earnings
In terms of median female earnings, the demographic groups most similar to Czechs are Slovak ($39,029, a difference of 0.090%), Immigrants from Uruguay ($38,945, a difference of 0.12%), Immigrants from Panama ($39,049, a difference of 0.15%), Panamanian ($39,049, a difference of 0.15%), and Immigrants from Colombia ($38,913, a difference of 0.20%).
| Demographics | Rating | Rank | Median Female Earnings |
| Immigrants | Costa Rica | 25.6 /100 | #196 | Fair $39,186 |
| Assyrians/Chaldeans/Syriacs | 24.6 /100 | #197 | Fair $39,159 |
| Ecuadorians | 23.0 /100 | #198 | Fair $39,117 |
| Icelanders | 22.7 /100 | #199 | Fair $39,109 |
| Immigrants | Panama | 20.6 /100 | #200 | Fair $39,049 |
| Panamanians | 20.6 /100 | #201 | Fair $39,049 |
| Slovaks | 19.9 /100 | #202 | Poor $39,029 |
| Czechs | 18.7 /100 | #203 | Poor $38,992 |
| Immigrants | Uruguay | 17.3 /100 | #204 | Poor $38,945 |
| Immigrants | Colombia | 16.3 /100 | #205 | Poor $38,913 |
| Immigrants | Bosnia and Herzegovina | 15.6 /100 | #206 | Poor $38,886 |
| Immigrants | Cambodia | 14.2 /100 | #207 | Poor $38,833 |
| Immigrants | Thailand | 13.6 /100 | #208 | Poor $38,810 |
| Norwegians | 13.4 /100 | #209 | Poor $38,802 |
| Czechoslovakians | 12.0 /100 | #210 | Poor $38,738 |
Demographics Similar to Sioux by Median Female Earnings
In terms of median female earnings, the demographic groups most similar to Sioux are Immigrants from Bahamas ($35,027, a difference of 0.10%), Honduran ($35,013, a difference of 0.14%), Fijian ($35,114, a difference of 0.15%), Chippewa ($35,003, a difference of 0.17%), and Bahamian ($35,125, a difference of 0.18%).
| Demographics | Rating | Rank | Median Female Earnings |
| Yuman | 0.0 /100 | #300 | Tragic $35,377 |
| Pima | 0.0 /100 | #301 | Tragic $35,326 |
| Blacks/African Americans | 0.0 /100 | #302 | Tragic $35,315 |
| Immigrants | Latin America | 0.0 /100 | #303 | Tragic $35,307 |
| Crow | 0.0 /100 | #304 | Tragic $35,266 |
| Bahamians | 0.0 /100 | #305 | Tragic $35,125 |
| Fijians | 0.0 /100 | #306 | Tragic $35,114 |
| Sioux | 0.0 /100 | #307 | Tragic $35,063 |
| Immigrants | Bahamas | 0.0 /100 | #308 | Tragic $35,027 |
| Hondurans | 0.0 /100 | #309 | Tragic $35,013 |
| Chippewa | 0.0 /100 | #310 | Tragic $35,003 |
| Ute | 0.0 /100 | #311 | Tragic $34,960 |
| Yaqui | 0.0 /100 | #312 | Tragic $34,943 |
| Cubans | 0.0 /100 | #313 | Tragic $34,942 |
| Apache | 0.0 /100 | #314 | Tragic $34,895 |