Czechoslovakian vs Immigrants from St. Vincent and the Grenadines Householder Income Ages 45 - 64 years
COMPARE
Czechoslovakian
Immigrants from St. Vincent and the Grenadines
Householder Income Ages 45 - 64 years
Householder Income Ages 45 - 64 years Comparison
Czechoslovakians
Immigrants from St. Vincent and the Grenadines
$101,387
HOUSEHOLDER INCOME AGES 45 - 64 YEARS
63.0/ 100
METRIC RATING
167th/ 347
METRIC RANK
$86,394
HOUSEHOLDER INCOME AGES 45 - 64 YEARS
0.1/ 100
METRIC RATING
288th/ 347
METRIC RANK
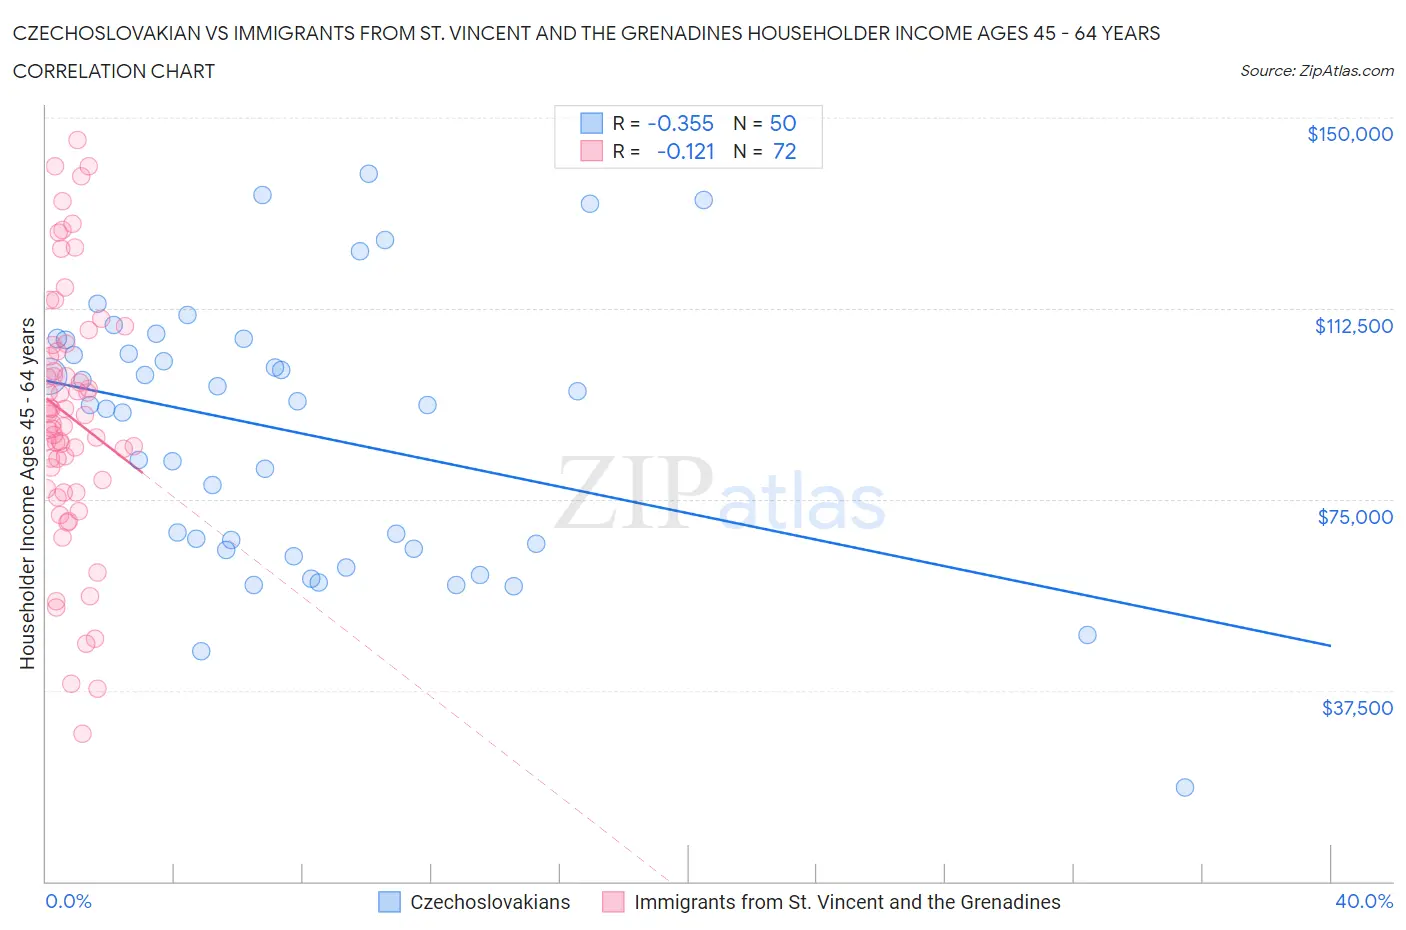
Czechoslovakian vs Immigrants from St. Vincent and the Grenadines Householder Income Ages 45 - 64 years Correlation Chart
The statistical analysis conducted on geographies consisting of 368,168,264 people shows a mild negative correlation between the proportion of Czechoslovakians and household income with householder between the ages 45 and 64 in the United States with a correlation coefficient (R) of -0.355 and weighted average of $101,387. Similarly, the statistical analysis conducted on geographies consisting of 56,172,416 people shows a poor negative correlation between the proportion of Immigrants from St. Vincent and the Grenadines and household income with householder between the ages 45 and 64 in the United States with a correlation coefficient (R) of -0.121 and weighted average of $86,394, a difference of 17.3%.
Householder Income Ages 45 - 64 years Correlation Summary
| Measurement | Czechoslovakian | Immigrants from St. Vincent and the Grenadines |
| Minimum | $18,333 | $29,032 |
| Maximum | $138,929 | $145,625 |
| Range | $120,596 | $116,593 |
| Mean | $87,984 | $91,362 |
| Median | $93,579 | $90,616 |
| Interquartile 25% (IQ1) | $65,365 | $78,013 |
| Interquartile 75% (IQ3) | $106,355 | $104,689 |
| Interquartile Range (IQR) | $40,989 | $26,677 |
| Standard Deviation (Sample) | $26,471 | $24,861 |
| Standard Deviation (Population) | $26,205 | $24,688 |
Similar Demographics by Householder Income Ages 45 - 64 years
Demographics Similar to Czechoslovakians by Householder Income Ages 45 - 64 years
In terms of householder income ages 45 - 64 years, the demographic groups most similar to Czechoslovakians are Samoan ($101,580, a difference of 0.19%), South American Indian ($101,171, a difference of 0.21%), Guamanian/Chamorro ($101,170, a difference of 0.21%), Slovak ($101,029, a difference of 0.35%), and South American ($100,837, a difference of 0.54%).
| Demographics | Rating | Rank | Householder Income Ages 45 - 64 years |
| Icelanders | 72.5 /100 | #160 | Good $102,261 |
| Immigrants | Nepal | 71.8 /100 | #161 | Good $102,190 |
| Scottish | 71.1 /100 | #162 | Good $102,123 |
| English | 70.1 /100 | #163 | Good $102,021 |
| Immigrants | Morocco | 70.0 /100 | #164 | Good $102,015 |
| Immigrants | Albania | 69.4 /100 | #165 | Good $101,957 |
| Samoans | 65.3 /100 | #166 | Good $101,580 |
| Czechoslovakians | 63.0 /100 | #167 | Good $101,387 |
| South American Indians | 60.5 /100 | #168 | Good $101,171 |
| Guamanians/Chamorros | 60.5 /100 | #169 | Good $101,170 |
| Slovaks | 58.8 /100 | #170 | Average $101,029 |
| South Americans | 56.4 /100 | #171 | Average $100,837 |
| Immigrants | Uzbekistan | 52.5 /100 | #172 | Average $100,523 |
| Alsatians | 51.4 /100 | #173 | Average $100,435 |
| Welsh | 50.0 /100 | #174 | Average $100,322 |
Demographics Similar to Immigrants from St. Vincent and the Grenadines by Householder Income Ages 45 - 64 years
In terms of householder income ages 45 - 64 years, the demographic groups most similar to Immigrants from St. Vincent and the Grenadines are Bangladeshi ($86,402, a difference of 0.010%), Cuban ($86,301, a difference of 0.11%), Immigrants from Guatemala ($86,573, a difference of 0.21%), Blackfeet ($86,595, a difference of 0.23%), and Cherokee ($86,125, a difference of 0.31%).
| Demographics | Rating | Rank | Householder Income Ages 45 - 64 years |
| Yaqui | 0.1 /100 | #281 | Tragic $86,914 |
| Senegalese | 0.1 /100 | #282 | Tragic $86,897 |
| Mexicans | 0.1 /100 | #283 | Tragic $86,816 |
| Central American Indians | 0.1 /100 | #284 | Tragic $86,764 |
| Blackfeet | 0.1 /100 | #285 | Tragic $86,595 |
| Immigrants | Guatemala | 0.1 /100 | #286 | Tragic $86,573 |
| Bangladeshis | 0.1 /100 | #287 | Tragic $86,402 |
| Immigrants | St. Vincent and the Grenadines | 0.1 /100 | #288 | Tragic $86,394 |
| Cubans | 0.1 /100 | #289 | Tragic $86,301 |
| Cherokee | 0.1 /100 | #290 | Tragic $86,125 |
| Hispanics or Latinos | 0.1 /100 | #291 | Tragic $86,006 |
| Immigrants | Central America | 0.1 /100 | #292 | Tragic $85,965 |
| Comanche | 0.1 /100 | #293 | Tragic $85,787 |
| British West Indians | 0.1 /100 | #294 | Tragic $85,571 |
| Immigrants | Grenada | 0.1 /100 | #295 | Tragic $85,552 |