Czechoslovakian vs Japanese Householder Income Ages 45 - 64 years
COMPARE
Czechoslovakian
Japanese
Householder Income Ages 45 - 64 years
Householder Income Ages 45 - 64 years Comparison
Czechoslovakians
Japanese
$101,387
HOUSEHOLDER INCOME AGES 45 - 64 YEARS
63.0/ 100
METRIC RATING
167th/ 347
METRIC RANK
$96,834
HOUSEHOLDER INCOME AGES 45 - 64 YEARS
14.8/ 100
METRIC RATING
209th/ 347
METRIC RANK
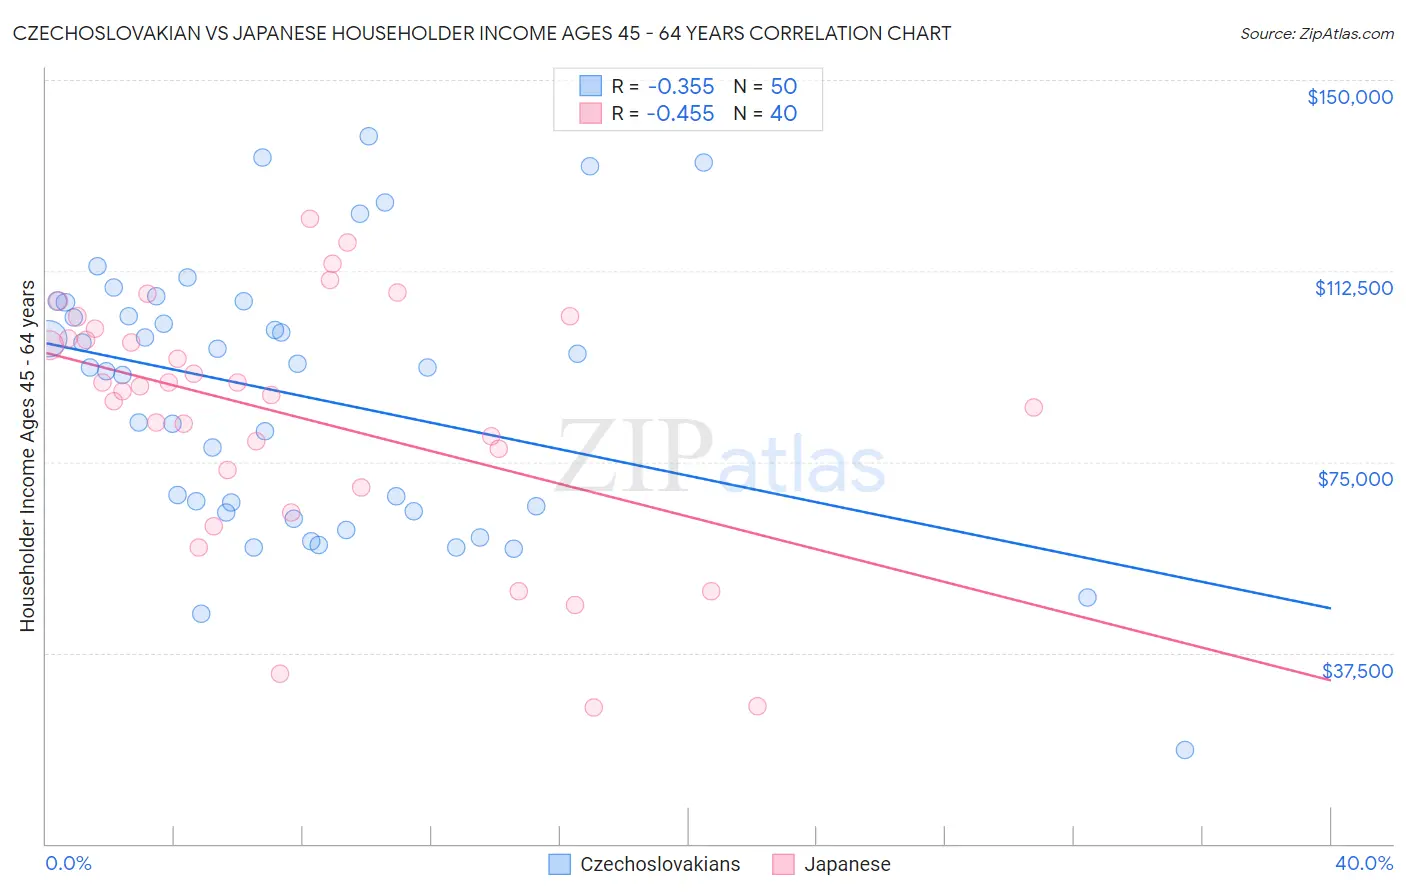
Czechoslovakian vs Japanese Householder Income Ages 45 - 64 years Correlation Chart
The statistical analysis conducted on geographies consisting of 368,168,264 people shows a mild negative correlation between the proportion of Czechoslovakians and household income with householder between the ages 45 and 64 in the United States with a correlation coefficient (R) of -0.355 and weighted average of $101,387. Similarly, the statistical analysis conducted on geographies consisting of 248,892,889 people shows a moderate negative correlation between the proportion of Japanese and household income with householder between the ages 45 and 64 in the United States with a correlation coefficient (R) of -0.455 and weighted average of $96,834, a difference of 4.7%.
Householder Income Ages 45 - 64 years Correlation Summary
| Measurement | Czechoslovakian | Japanese |
| Minimum | $18,333 | $26,741 |
| Maximum | $138,929 | $122,806 |
| Range | $120,596 | $96,065 |
| Mean | $87,984 | $83,850 |
| Median | $93,579 | $89,335 |
| Interquartile 25% (IQ1) | $65,365 | $71,693 |
| Interquartile 75% (IQ3) | $106,355 | $100,167 |
| Interquartile Range (IQR) | $40,989 | $28,474 |
| Standard Deviation (Sample) | $26,471 | $24,280 |
| Standard Deviation (Population) | $26,205 | $23,975 |
Similar Demographics by Householder Income Ages 45 - 64 years
Demographics Similar to Czechoslovakians by Householder Income Ages 45 - 64 years
In terms of householder income ages 45 - 64 years, the demographic groups most similar to Czechoslovakians are Samoan ($101,580, a difference of 0.19%), South American Indian ($101,171, a difference of 0.21%), Guamanian/Chamorro ($101,170, a difference of 0.21%), Slovak ($101,029, a difference of 0.35%), and South American ($100,837, a difference of 0.54%).
| Demographics | Rating | Rank | Householder Income Ages 45 - 64 years |
| Icelanders | 72.5 /100 | #160 | Good $102,261 |
| Immigrants | Nepal | 71.8 /100 | #161 | Good $102,190 |
| Scottish | 71.1 /100 | #162 | Good $102,123 |
| English | 70.1 /100 | #163 | Good $102,021 |
| Immigrants | Morocco | 70.0 /100 | #164 | Good $102,015 |
| Immigrants | Albania | 69.4 /100 | #165 | Good $101,957 |
| Samoans | 65.3 /100 | #166 | Good $101,580 |
| Czechoslovakians | 63.0 /100 | #167 | Good $101,387 |
| South American Indians | 60.5 /100 | #168 | Good $101,171 |
| Guamanians/Chamorros | 60.5 /100 | #169 | Good $101,170 |
| Slovaks | 58.8 /100 | #170 | Average $101,029 |
| South Americans | 56.4 /100 | #171 | Average $100,837 |
| Immigrants | Uzbekistan | 52.5 /100 | #172 | Average $100,523 |
| Alsatians | 51.4 /100 | #173 | Average $100,435 |
| Welsh | 50.0 /100 | #174 | Average $100,322 |
Demographics Similar to Japanese by Householder Income Ages 45 - 64 years
In terms of householder income ages 45 - 64 years, the demographic groups most similar to Japanese are Tsimshian ($96,783, a difference of 0.050%), Scotch-Irish ($97,073, a difference of 0.25%), Immigrants from Cambodia ($96,537, a difference of 0.31%), Venezuelan ($96,460, a difference of 0.39%), and Immigrants from Africa ($97,284, a difference of 0.46%).
| Demographics | Rating | Rank | Householder Income Ages 45 - 64 years |
| Tlingit-Haida | 18.9 /100 | #202 | Poor $97,417 |
| Immigrants | Thailand | 18.8 /100 | #203 | Poor $97,400 |
| Immigrants | Eritrea | 18.6 /100 | #204 | Poor $97,373 |
| Immigrants | Colombia | 18.0 /100 | #205 | Poor $97,290 |
| Immigrants | Africa | 17.9 /100 | #206 | Poor $97,284 |
| Ghanaians | 17.9 /100 | #207 | Poor $97,277 |
| Scotch-Irish | 16.4 /100 | #208 | Poor $97,073 |
| Japanese | 14.8 /100 | #209 | Poor $96,834 |
| Tsimshian | 14.5 /100 | #210 | Poor $96,783 |
| Immigrants | Cambodia | 13.0 /100 | #211 | Poor $96,537 |
| Venezuelans | 12.6 /100 | #212 | Poor $96,460 |
| Immigrants | Uruguay | 10.7 /100 | #213 | Poor $96,086 |
| Panamanians | 10.6 /100 | #214 | Poor $96,066 |
| Nigerians | 8.2 /100 | #215 | Tragic $95,492 |
| Immigrants | Venezuela | 7.6 /100 | #216 | Tragic $95,342 |