Cypriot vs Immigrants from the Azores Householder Income Under 25 years
COMPARE
Cypriot
Immigrants from the Azores
Householder Income Under 25 years
Householder Income Under 25 years Comparison
Cypriots
Immigrants from the Azores
$52,209
HOUSEHOLDER INCOME UNDER 25 YEARS
51.2/ 100
METRIC RATING
172nd/ 347
METRIC RANK
$52,621
HOUSEHOLDER INCOME UNDER 25 YEARS
74.2/ 100
METRIC RATING
154th/ 347
METRIC RANK
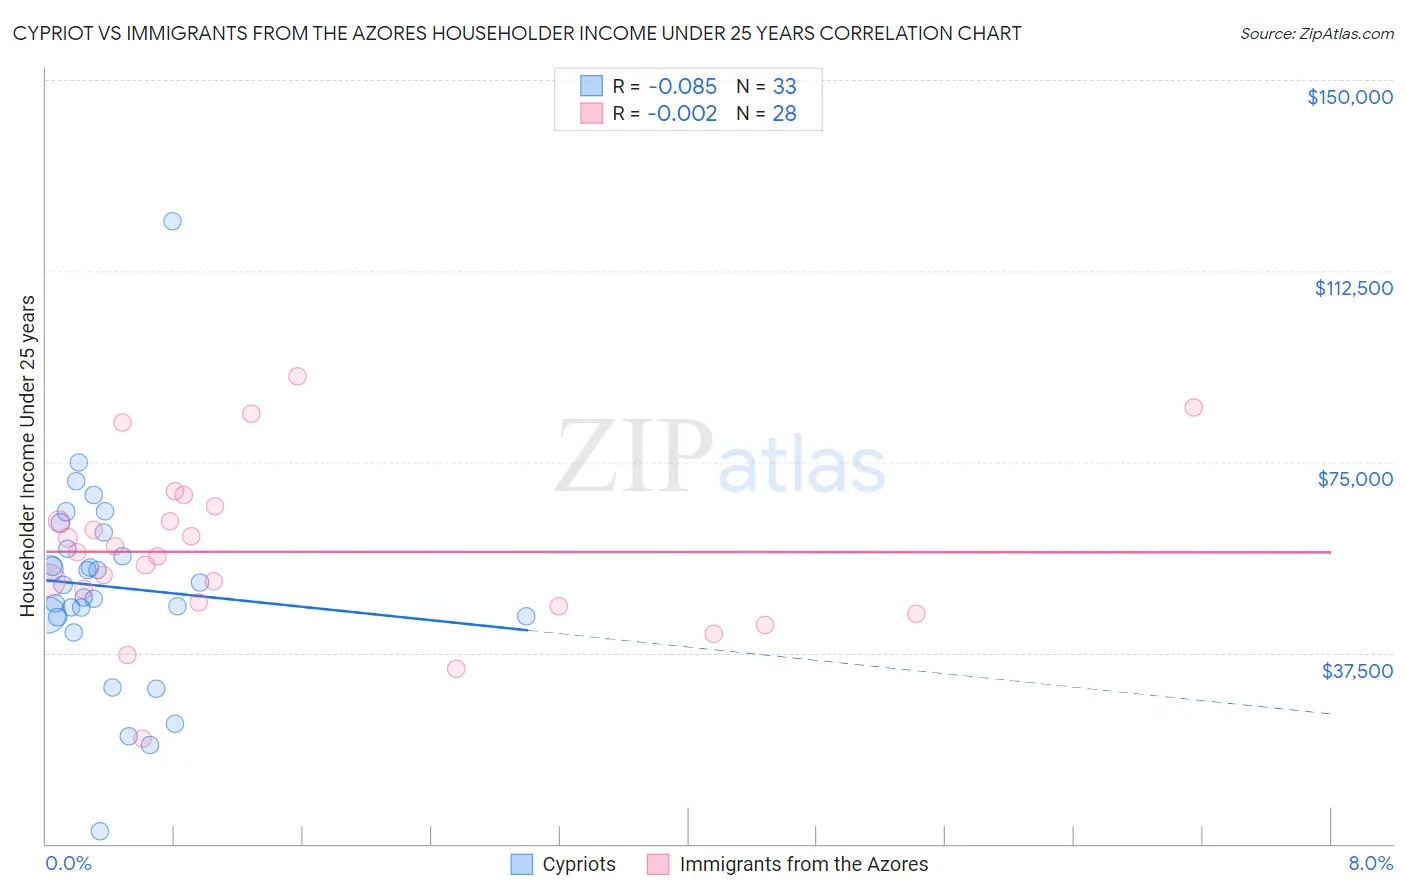
Cypriot vs Immigrants from the Azores Householder Income Under 25 years Correlation Chart
The statistical analysis conducted on geographies consisting of 57,005,304 people shows a slight negative correlation between the proportion of Cypriots and household income with householder under the age of 25 in the United States with a correlation coefficient (R) of -0.085 and weighted average of $52,209. Similarly, the statistical analysis conducted on geographies consisting of 40,962,746 people shows no correlation between the proportion of Immigrants from the Azores and household income with householder under the age of 25 in the United States with a correlation coefficient (R) of -0.002 and weighted average of $52,621, a difference of 0.79%.
Householder Income Under 25 years Correlation Summary
| Measurement | Cypriot | Immigrants from the Azores |
| Minimum | $2,499 | $20,652 |
| Maximum | $122,212 | $91,938 |
| Range | $119,713 | $71,286 |
| Mean | $50,436 | $57,341 |
| Median | $50,796 | $56,819 |
| Interquartile 25% (IQ1) | $44,534 | $46,997 |
| Interquartile 75% (IQ3) | $59,526 | $64,729 |
| Interquartile Range (IQR) | $14,992 | $17,732 |
| Standard Deviation (Sample) | $20,344 | $16,204 |
| Standard Deviation (Population) | $20,033 | $15,912 |
Demographics Similar to Cypriots and Immigrants from the Azores by Householder Income Under 25 years
In terms of householder income under 25 years, the demographic groups most similar to Cypriots are Barbadian ($52,202, a difference of 0.010%), Immigrants from Uruguay ($52,302, a difference of 0.18%), Canadian ($52,336, a difference of 0.24%), Israeli ($52,335, a difference of 0.24%), and Japanese ($52,365, a difference of 0.30%). Similarly, the demographic groups most similar to Immigrants from the Azores are Central American ($52,626, a difference of 0.010%), Immigrants from Denmark ($52,612, a difference of 0.020%), Immigrants from Nepal ($52,611, a difference of 0.020%), Ghanaian ($52,594, a difference of 0.050%), and Immigrants from Netherlands ($52,592, a difference of 0.060%).
| Demographics | Rating | Rank | Householder Income Under 25 years |
| Central Americans | 74.4 /100 | #153 | Good $52,626 |
| Immigrants | Azores | 74.2 /100 | #154 | Good $52,621 |
| Immigrants | Denmark | 73.8 /100 | #155 | Good $52,612 |
| Immigrants | Nepal | 73.7 /100 | #156 | Good $52,611 |
| Ghanaians | 72.9 /100 | #157 | Good $52,594 |
| Immigrants | Netherlands | 72.8 /100 | #158 | Good $52,592 |
| Mongolians | 70.2 /100 | #159 | Good $52,540 |
| Immigrants | Turkey | 68.3 /100 | #160 | Good $52,503 |
| Uruguayans | 66.2 /100 | #161 | Good $52,465 |
| Immigrants | Cambodia | 65.4 /100 | #162 | Good $52,450 |
| Immigrants | Chile | 64.8 /100 | #163 | Good $52,440 |
| Immigrants | Trinidad and Tobago | 64.7 /100 | #164 | Good $52,437 |
| Poles | 63.0 /100 | #165 | Good $52,407 |
| Immigrants | Austria | 62.6 /100 | #166 | Good $52,400 |
| Immigrants | Uganda | 61.1 /100 | #167 | Good $52,374 |
| Japanese | 60.5 /100 | #168 | Good $52,365 |
| Canadians | 58.8 /100 | #169 | Average $52,336 |
| Israelis | 58.8 /100 | #170 | Average $52,335 |
| Immigrants | Uruguay | 56.8 /100 | #171 | Average $52,302 |
| Cypriots | 51.2 /100 | #172 | Average $52,209 |
| Barbadians | 50.8 /100 | #173 | Average $52,202 |