Cypriot vs Japanese Householder Income Under 25 years
COMPARE
Cypriot
Japanese
Householder Income Under 25 years
Householder Income Under 25 years Comparison
Cypriots
Japanese
$52,209
HOUSEHOLDER INCOME UNDER 25 YEARS
51.2/ 100
METRIC RATING
172nd/ 347
METRIC RANK
$52,365
HOUSEHOLDER INCOME UNDER 25 YEARS
60.5/ 100
METRIC RATING
168th/ 347
METRIC RANK
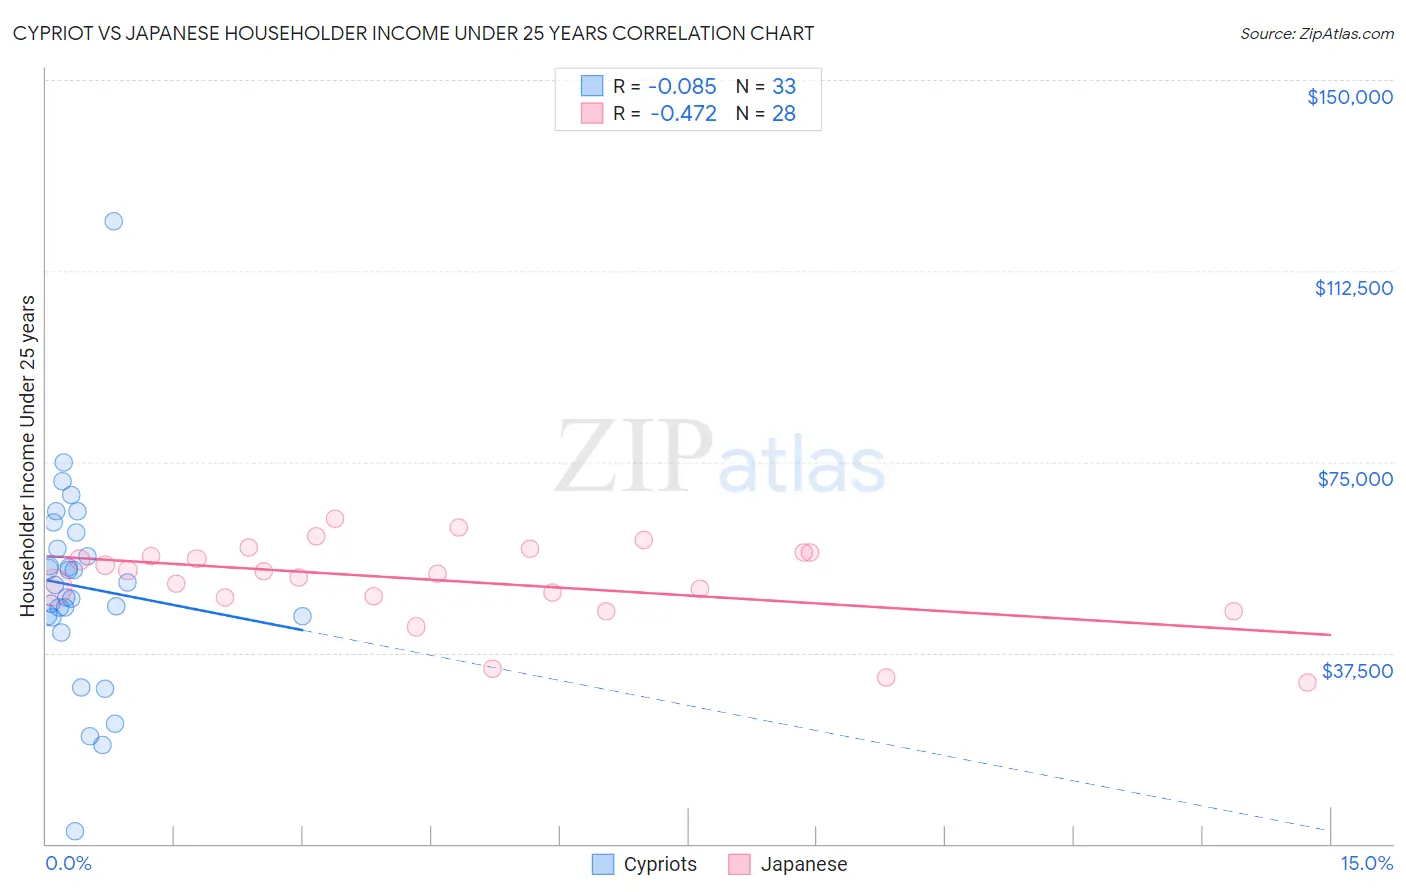
Cypriot vs Japanese Householder Income Under 25 years Correlation Chart
The statistical analysis conducted on geographies consisting of 57,005,304 people shows a slight negative correlation between the proportion of Cypriots and household income with householder under the age of 25 in the United States with a correlation coefficient (R) of -0.085 and weighted average of $52,209. Similarly, the statistical analysis conducted on geographies consisting of 222,746,712 people shows a moderate negative correlation between the proportion of Japanese and household income with householder under the age of 25 in the United States with a correlation coefficient (R) of -0.472 and weighted average of $52,365, a difference of 0.30%.
Householder Income Under 25 years Correlation Summary
| Measurement | Cypriot | Japanese |
| Minimum | $2,499 | $31,569 |
| Maximum | $122,212 | $63,892 |
| Range | $119,713 | $32,323 |
| Mean | $50,436 | $51,521 |
| Median | $50,796 | $53,255 |
| Interquartile 25% (IQ1) | $44,534 | $48,512 |
| Interquartile 75% (IQ3) | $59,526 | $57,313 |
| Interquartile Range (IQR) | $14,992 | $8,801 |
| Standard Deviation (Sample) | $20,344 | $8,318 |
| Standard Deviation (Population) | $20,033 | $8,169 |
Demographics Similar to Cypriots and Japanese by Householder Income Under 25 years
In terms of householder income under 25 years, the demographic groups most similar to Cypriots are Barbadian ($52,202, a difference of 0.010%), Immigrants from Western Asia ($52,190, a difference of 0.040%), Immigrants from Uruguay ($52,302, a difference of 0.18%), Canadian ($52,336, a difference of 0.24%), and Israeli ($52,335, a difference of 0.24%). Similarly, the demographic groups most similar to Japanese are Immigrants from Uganda ($52,374, a difference of 0.020%), Canadian ($52,336, a difference of 0.060%), Israeli ($52,335, a difference of 0.060%), Immigrants from Austria ($52,400, a difference of 0.070%), and Polish ($52,407, a difference of 0.080%).
| Demographics | Rating | Rank | Householder Income Under 25 years |
| Immigrants | Turkey | 68.3 /100 | #160 | Good $52,503 |
| Uruguayans | 66.2 /100 | #161 | Good $52,465 |
| Immigrants | Cambodia | 65.4 /100 | #162 | Good $52,450 |
| Immigrants | Chile | 64.8 /100 | #163 | Good $52,440 |
| Immigrants | Trinidad and Tobago | 64.7 /100 | #164 | Good $52,437 |
| Poles | 63.0 /100 | #165 | Good $52,407 |
| Immigrants | Austria | 62.6 /100 | #166 | Good $52,400 |
| Immigrants | Uganda | 61.1 /100 | #167 | Good $52,374 |
| Japanese | 60.5 /100 | #168 | Good $52,365 |
| Canadians | 58.8 /100 | #169 | Average $52,336 |
| Israelis | 58.8 /100 | #170 | Average $52,335 |
| Immigrants | Uruguay | 56.8 /100 | #171 | Average $52,302 |
| Cypriots | 51.2 /100 | #172 | Average $52,209 |
| Barbadians | 50.8 /100 | #173 | Average $52,202 |
| Immigrants | Western Asia | 50.0 /100 | #174 | Average $52,190 |
| Immigrants | Zimbabwe | 33.8 /100 | #175 | Fair $51,914 |
| Austrians | 32.9 /100 | #176 | Fair $51,898 |
| British West Indians | 30.0 /100 | #177 | Fair $51,844 |
| Finns | 29.2 /100 | #178 | Fair $51,827 |
| Basques | 28.7 /100 | #179 | Fair $51,818 |
| Immigrants | England | 28.7 /100 | #180 | Fair $51,817 |