Lithuanian vs Immigrants from Egypt Householder Income Ages 45 - 64 years
COMPARE
Lithuanian
Immigrants from Egypt
Householder Income Ages 45 - 64 years
Householder Income Ages 45 - 64 years Comparison
Lithuanians
Immigrants from Egypt
$112,484
HOUSEHOLDER INCOME AGES 45 - 64 YEARS
99.8/ 100
METRIC RATING
55th/ 347
METRIC RANK
$109,941
HOUSEHOLDER INCOME AGES 45 - 64 YEARS
99.2/ 100
METRIC RATING
74th/ 347
METRIC RANK
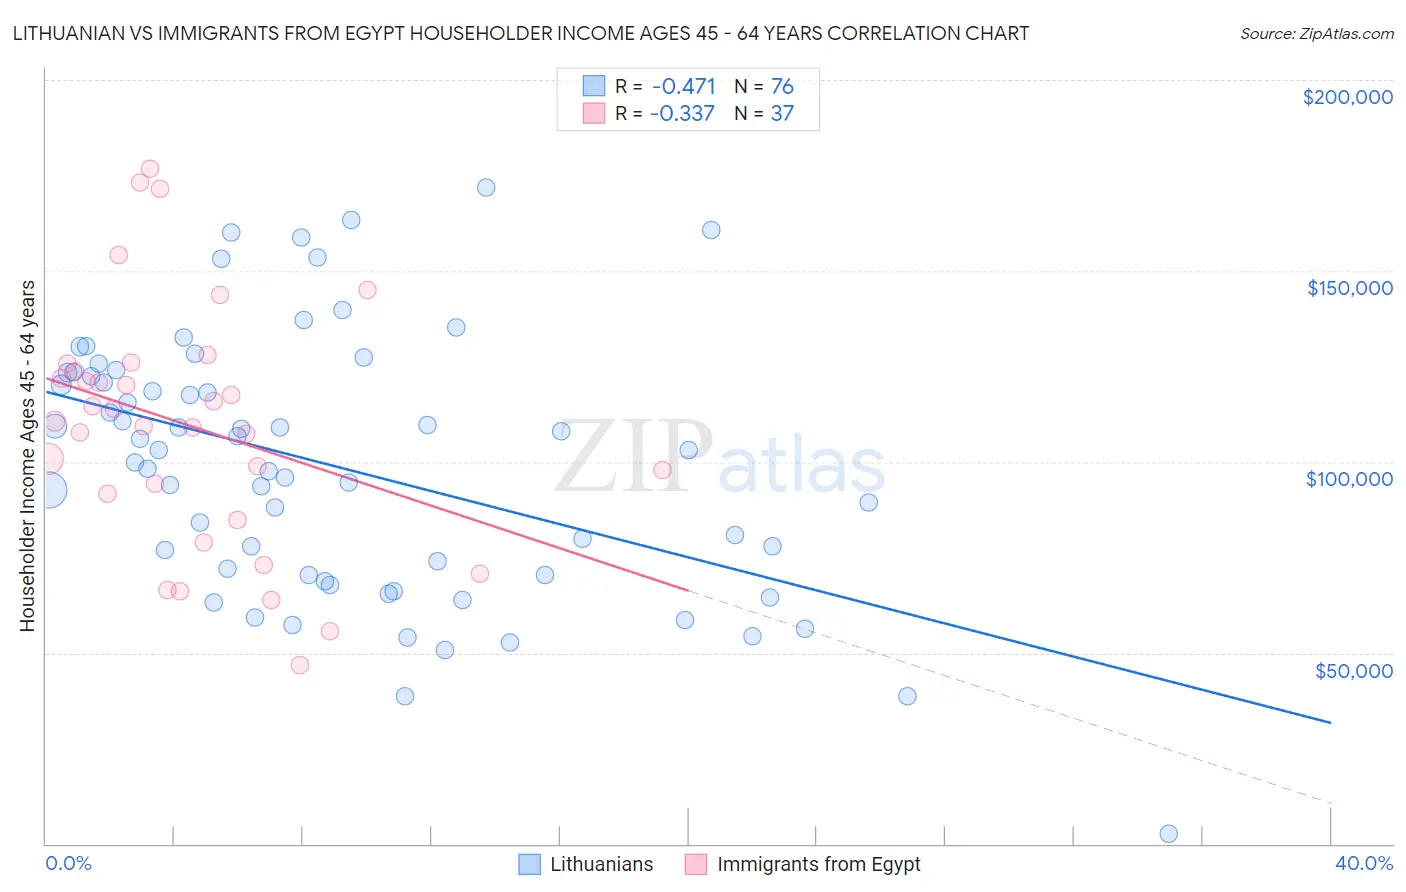
Lithuanian vs Immigrants from Egypt Householder Income Ages 45 - 64 years Correlation Chart
The statistical analysis conducted on geographies consisting of 421,155,737 people shows a moderate negative correlation between the proportion of Lithuanians and household income with householder between the ages 45 and 64 in the United States with a correlation coefficient (R) of -0.471 and weighted average of $112,484. Similarly, the statistical analysis conducted on geographies consisting of 245,345,786 people shows a mild negative correlation between the proportion of Immigrants from Egypt and household income with householder between the ages 45 and 64 in the United States with a correlation coefficient (R) of -0.337 and weighted average of $109,941, a difference of 2.3%.
Householder Income Ages 45 - 64 years Correlation Summary
| Measurement | Lithuanian | Immigrants from Egypt |
| Minimum | $2,499 | $46,773 |
| Maximum | $171,736 | $176,674 |
| Range | $169,237 | $129,901 |
| Mean | $98,659 | $109,415 |
| Median | $101,418 | $110,780 |
| Interquartile 25% (IQ1) | $70,474 | $88,195 |
| Interquartile 75% (IQ3) | $122,894 | $124,792 |
| Interquartile Range (IQR) | $52,420 | $36,597 |
| Standard Deviation (Sample) | $34,121 | $31,863 |
| Standard Deviation (Population) | $33,896 | $31,429 |
Demographics Similar to Lithuanians and Immigrants from Egypt by Householder Income Ages 45 - 64 years
In terms of householder income ages 45 - 64 years, the demographic groups most similar to Lithuanians are Greek ($112,630, a difference of 0.13%), Egyptian ($112,256, a difference of 0.20%), Immigrants from Scotland ($112,175, a difference of 0.28%), Soviet Union ($112,008, a difference of 0.43%), and Immigrants from Europe ($111,984, a difference of 0.45%). Similarly, the demographic groups most similar to Immigrants from Egypt are Argentinean ($110,103, a difference of 0.15%), Assyrian/Chaldean/Syriac ($110,201, a difference of 0.24%), Italian ($110,224, a difference of 0.26%), Korean ($110,334, a difference of 0.36%), and Immigrants from Italy ($110,434, a difference of 0.45%).
| Demographics | Rating | Rank | Householder Income Ages 45 - 64 years |
| Greeks | 99.8 /100 | #54 | Exceptional $112,630 |
| Lithuanians | 99.8 /100 | #55 | Exceptional $112,484 |
| Egyptians | 99.7 /100 | #56 | Exceptional $112,256 |
| Immigrants | Scotland | 99.7 /100 | #57 | Exceptional $112,175 |
| Soviet Union | 99.7 /100 | #58 | Exceptional $112,008 |
| Immigrants | Europe | 99.7 /100 | #59 | Exceptional $111,984 |
| Immigrants | Netherlands | 99.7 /100 | #60 | Exceptional $111,982 |
| Immigrants | Czechoslovakia | 99.7 /100 | #61 | Exceptional $111,914 |
| Immigrants | Norway | 99.7 /100 | #62 | Exceptional $111,669 |
| Mongolians | 99.6 /100 | #63 | Exceptional $111,602 |
| Immigrants | Latvia | 99.6 /100 | #64 | Exceptional $111,454 |
| Immigrants | Belarus | 99.6 /100 | #65 | Exceptional $111,430 |
| New Zealanders | 99.6 /100 | #66 | Exceptional $111,286 |
| Laotians | 99.5 /100 | #67 | Exceptional $111,051 |
| Immigrants | Romania | 99.4 /100 | #68 | Exceptional $110,633 |
| Immigrants | Italy | 99.4 /100 | #69 | Exceptional $110,434 |
| Koreans | 99.3 /100 | #70 | Exceptional $110,334 |
| Italians | 99.3 /100 | #71 | Exceptional $110,224 |
| Assyrians/Chaldeans/Syriacs | 99.3 /100 | #72 | Exceptional $110,201 |
| Argentineans | 99.3 /100 | #73 | Exceptional $110,103 |
| Immigrants | Egypt | 99.2 /100 | #74 | Exceptional $109,941 |