American vs Immigrants from Egypt Householder Income Ages 45 - 64 years
COMPARE
American
Immigrants from Egypt
Householder Income Ages 45 - 64 years
Householder Income Ages 45 - 64 years Comparison
Americans
Immigrants from Egypt
$90,536
HOUSEHOLDER INCOME AGES 45 - 64 YEARS
0.7/ 100
METRIC RATING
251st/ 347
METRIC RANK
$109,941
HOUSEHOLDER INCOME AGES 45 - 64 YEARS
99.2/ 100
METRIC RATING
74th/ 347
METRIC RANK
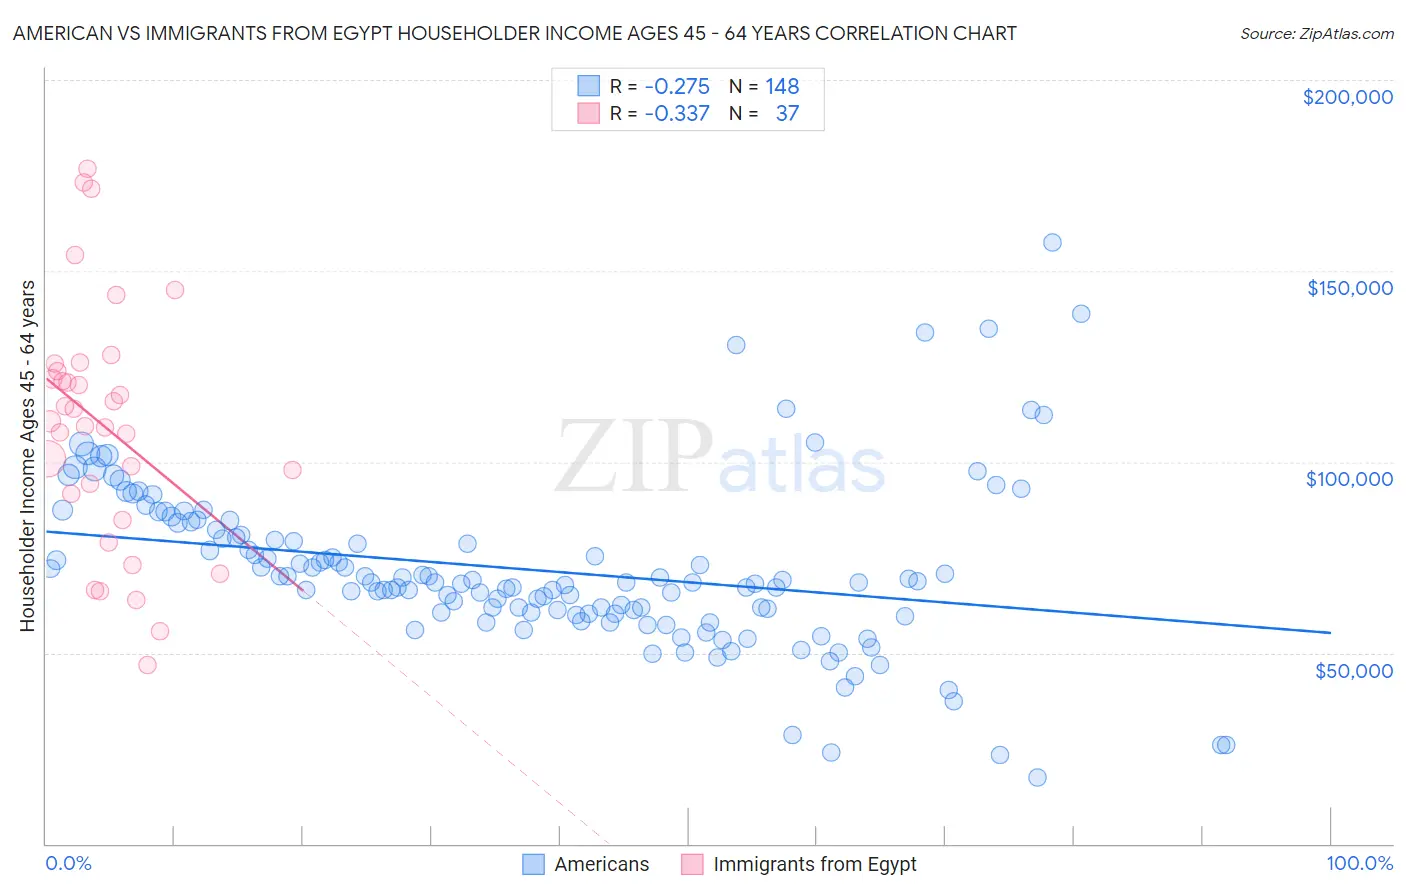
American vs Immigrants from Egypt Householder Income Ages 45 - 64 years Correlation Chart
The statistical analysis conducted on geographies consisting of 577,131,423 people shows a weak negative correlation between the proportion of Americans and household income with householder between the ages 45 and 64 in the United States with a correlation coefficient (R) of -0.275 and weighted average of $90,536. Similarly, the statistical analysis conducted on geographies consisting of 245,345,786 people shows a mild negative correlation between the proportion of Immigrants from Egypt and household income with householder between the ages 45 and 64 in the United States with a correlation coefficient (R) of -0.337 and weighted average of $109,941, a difference of 21.4%.
Householder Income Ages 45 - 64 years Correlation Summary
| Measurement | American | Immigrants from Egypt |
| Minimum | $17,292 | $46,773 |
| Maximum | $157,566 | $176,674 |
| Range | $140,274 | $129,901 |
| Mean | $71,716 | $109,415 |
| Median | $68,424 | $110,780 |
| Interquartile 25% (IQ1) | $60,397 | $88,195 |
| Interquartile 75% (IQ3) | $81,558 | $124,792 |
| Interquartile Range (IQR) | $21,160 | $36,597 |
| Standard Deviation (Sample) | $21,955 | $31,863 |
| Standard Deviation (Population) | $21,881 | $31,429 |
Similar Demographics by Householder Income Ages 45 - 64 years
Demographics Similar to Americans by Householder Income Ages 45 - 64 years
In terms of householder income ages 45 - 64 years, the demographic groups most similar to Americans are Marshallese ($90,455, a difference of 0.090%), Subsaharan African ($90,691, a difference of 0.17%), Mexican American Indian ($90,811, a difference of 0.30%), Barbadian ($90,266, a difference of 0.30%), and Immigrants from Guyana ($90,186, a difference of 0.39%).
| Demographics | Rating | Rank | Householder Income Ages 45 - 64 years |
| Immigrants | Middle Africa | 1.1 /100 | #244 | Tragic $91,293 |
| Guyanese | 0.9 /100 | #245 | Tragic $90,966 |
| Central Americans | 0.9 /100 | #246 | Tragic $90,951 |
| Alaskan Athabascans | 0.9 /100 | #247 | Tragic $90,951 |
| Immigrants | Laos | 0.9 /100 | #248 | Tragic $90,909 |
| Mexican American Indians | 0.8 /100 | #249 | Tragic $90,811 |
| Sub-Saharan Africans | 0.8 /100 | #250 | Tragic $90,691 |
| Americans | 0.7 /100 | #251 | Tragic $90,536 |
| Marshallese | 0.7 /100 | #252 | Tragic $90,455 |
| Barbadians | 0.6 /100 | #253 | Tragic $90,266 |
| Immigrants | Guyana | 0.6 /100 | #254 | Tragic $90,186 |
| West Indians | 0.5 /100 | #255 | Tragic $89,906 |
| French American Indians | 0.5 /100 | #256 | Tragic $89,811 |
| German Russians | 0.4 /100 | #257 | Tragic $89,398 |
| Immigrants | Barbados | 0.4 /100 | #258 | Tragic $89,394 |
Demographics Similar to Immigrants from Egypt by Householder Income Ages 45 - 64 years
In terms of householder income ages 45 - 64 years, the demographic groups most similar to Immigrants from Egypt are Argentinean ($110,103, a difference of 0.15%), South African ($109,719, a difference of 0.20%), Assyrian/Chaldean/Syriac ($110,201, a difference of 0.24%), Italian ($110,224, a difference of 0.26%), and Korean ($110,334, a difference of 0.36%).
| Demographics | Rating | Rank | Householder Income Ages 45 - 64 years |
| Laotians | 99.5 /100 | #67 | Exceptional $111,051 |
| Immigrants | Romania | 99.4 /100 | #68 | Exceptional $110,633 |
| Immigrants | Italy | 99.4 /100 | #69 | Exceptional $110,434 |
| Koreans | 99.3 /100 | #70 | Exceptional $110,334 |
| Italians | 99.3 /100 | #71 | Exceptional $110,224 |
| Assyrians/Chaldeans/Syriacs | 99.3 /100 | #72 | Exceptional $110,201 |
| Argentineans | 99.3 /100 | #73 | Exceptional $110,103 |
| Immigrants | Egypt | 99.2 /100 | #74 | Exceptional $109,941 |
| South Africans | 99.1 /100 | #75 | Exceptional $109,719 |
| Paraguayans | 99.0 /100 | #76 | Exceptional $109,447 |
| Immigrants | England | 99.0 /100 | #77 | Exceptional $109,446 |
| Immigrants | Canada | 99.0 /100 | #78 | Exceptional $109,402 |
| Immigrants | Bulgaria | 98.9 /100 | #79 | Exceptional $109,379 |
| Jordanians | 98.9 /100 | #80 | Exceptional $109,376 |
| Immigrants | Eastern Europe | 98.9 /100 | #81 | Exceptional $109,335 |