Cuban vs Immigrants from South Africa Householder Income Ages 25 - 44 years
COMPARE
Cuban
Immigrants from South Africa
Householder Income Ages 25 - 44 years
Householder Income Ages 25 - 44 years Comparison
Cubans
Immigrants from South Africa
$81,483
HOUSEHOLDER INCOME AGES 25 - 44 YEARS
0.1/ 100
METRIC RATING
294th/ 347
METRIC RANK
$105,748
HOUSEHOLDER INCOME AGES 25 - 44 YEARS
99.8/ 100
METRIC RATING
58th/ 347
METRIC RANK
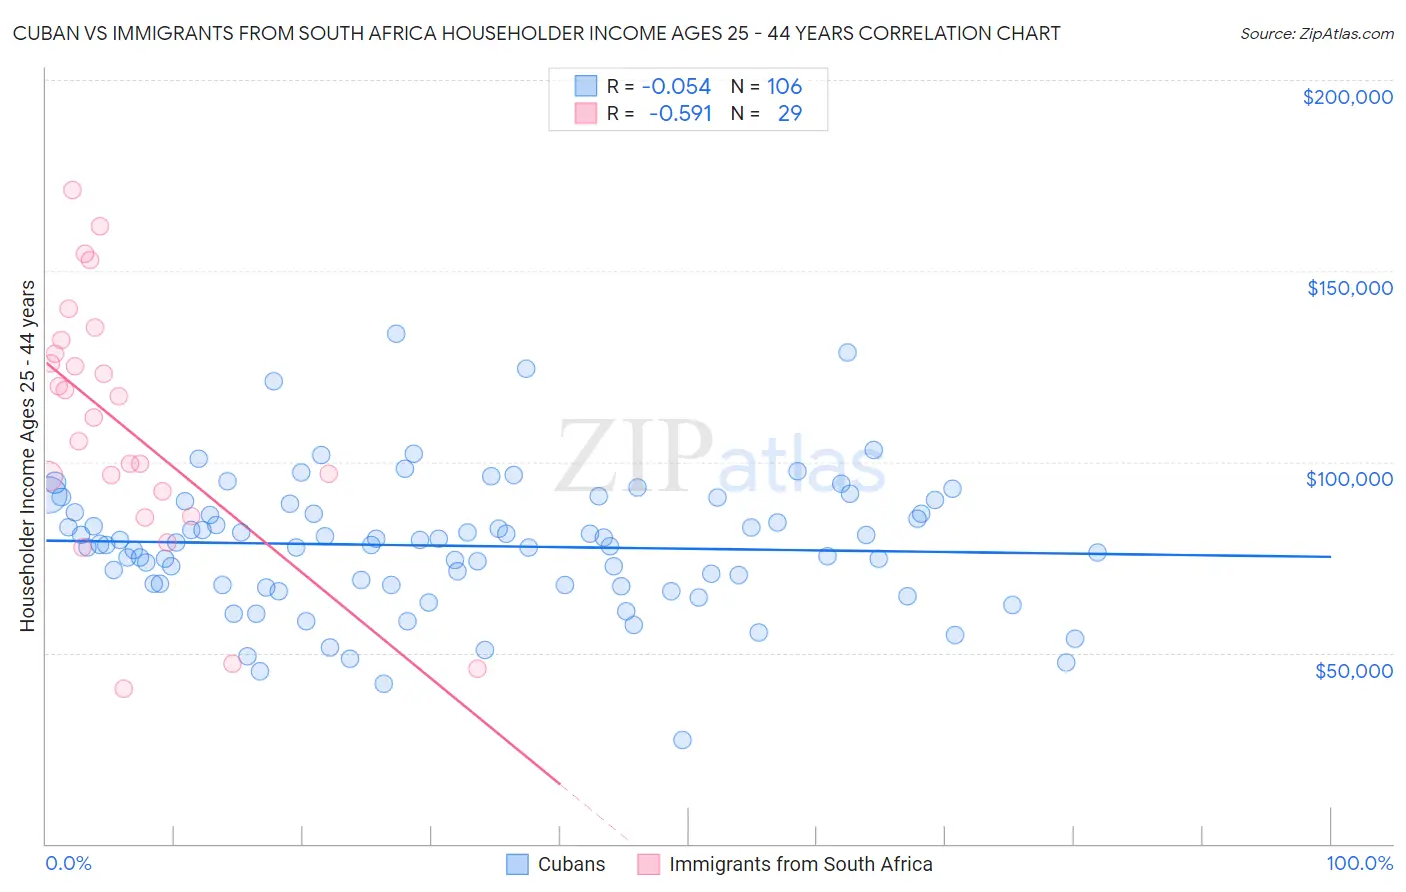
Cuban vs Immigrants from South Africa Householder Income Ages 25 - 44 years Correlation Chart
The statistical analysis conducted on geographies consisting of 447,656,503 people shows a slight negative correlation between the proportion of Cubans and household income with householder between the ages 25 and 44 in the United States with a correlation coefficient (R) of -0.054 and weighted average of $81,483. Similarly, the statistical analysis conducted on geographies consisting of 232,878,051 people shows a substantial negative correlation between the proportion of Immigrants from South Africa and household income with householder between the ages 25 and 44 in the United States with a correlation coefficient (R) of -0.591 and weighted average of $105,748, a difference of 29.8%.
Householder Income Ages 25 - 44 years Correlation Summary
| Measurement | Cuban | Immigrants from South Africa |
| Minimum | $27,125 | $40,500 |
| Maximum | $133,668 | $171,037 |
| Range | $106,543 | $130,537 |
| Mean | $78,016 | $109,111 |
| Median | $78,321 | $111,695 |
| Interquartile 25% (IQ1) | $67,806 | $89,017 |
| Interquartile 75% (IQ3) | $86,783 | $130,136 |
| Interquartile Range (IQR) | $18,977 | $41,119 |
| Standard Deviation (Sample) | $17,466 | $33,105 |
| Standard Deviation (Population) | $17,384 | $32,529 |
Similar Demographics by Householder Income Ages 25 - 44 years
Demographics Similar to Cubans by Householder Income Ages 25 - 44 years
In terms of householder income ages 25 - 44 years, the demographic groups most similar to Cubans are Blackfeet ($81,531, a difference of 0.060%), Bangladeshi ($81,363, a difference of 0.15%), Immigrants from Dominica ($81,351, a difference of 0.16%), Immigrants from Guatemala ($81,341, a difference of 0.17%), and Yaqui ($81,656, a difference of 0.21%).
| Demographics | Rating | Rank | Householder Income Ages 25 - 44 years |
| Immigrants | Latin America | 0.1 /100 | #287 | Tragic $82,166 |
| Comanche | 0.1 /100 | #288 | Tragic $82,152 |
| Shoshone | 0.1 /100 | #289 | Tragic $82,062 |
| Liberians | 0.1 /100 | #290 | Tragic $82,005 |
| Potawatomi | 0.1 /100 | #291 | Tragic $81,774 |
| Yaqui | 0.1 /100 | #292 | Tragic $81,656 |
| Blackfeet | 0.1 /100 | #293 | Tragic $81,531 |
| Cubans | 0.1 /100 | #294 | Tragic $81,483 |
| Bangladeshis | 0.1 /100 | #295 | Tragic $81,363 |
| Immigrants | Dominica | 0.1 /100 | #296 | Tragic $81,351 |
| Immigrants | Guatemala | 0.1 /100 | #297 | Tragic $81,341 |
| Dominicans | 0.1 /100 | #298 | Tragic $81,229 |
| Immigrants | Liberia | 0.1 /100 | #299 | Tragic $80,863 |
| Cherokee | 0.0 /100 | #300 | Tragic $80,843 |
| Immigrants | Micronesia | 0.0 /100 | #301 | Tragic $80,544 |
Demographics Similar to Immigrants from South Africa by Householder Income Ages 25 - 44 years
In terms of householder income ages 25 - 44 years, the demographic groups most similar to Immigrants from South Africa are Immigrants from Latvia ($105,522, a difference of 0.21%), Immigrants from Austria ($106,103, a difference of 0.34%), Immigrants from Pakistan ($106,129, a difference of 0.36%), Egyptian ($105,282, a difference of 0.44%), and Lithuanian ($105,223, a difference of 0.50%).
| Demographics | Rating | Rank | Householder Income Ages 25 - 44 years |
| Immigrants | Czechoslovakia | 99.9 /100 | #51 | Exceptional $106,888 |
| Immigrants | Europe | 99.9 /100 | #52 | Exceptional $106,817 |
| Immigrants | Norway | 99.9 /100 | #53 | Exceptional $106,629 |
| Paraguayans | 99.9 /100 | #54 | Exceptional $106,615 |
| Greeks | 99.9 /100 | #55 | Exceptional $106,457 |
| Immigrants | Pakistan | 99.8 /100 | #56 | Exceptional $106,129 |
| Immigrants | Austria | 99.8 /100 | #57 | Exceptional $106,103 |
| Immigrants | South Africa | 99.8 /100 | #58 | Exceptional $105,748 |
| Immigrants | Latvia | 99.8 /100 | #59 | Exceptional $105,522 |
| Egyptians | 99.7 /100 | #60 | Exceptional $105,282 |
| Lithuanians | 99.7 /100 | #61 | Exceptional $105,223 |
| Immigrants | Italy | 99.7 /100 | #62 | Exceptional $105,201 |
| Immigrants | Scotland | 99.7 /100 | #63 | Exceptional $105,089 |
| New Zealanders | 99.7 /100 | #64 | Exceptional $105,085 |
| Immigrants | Netherlands | 99.7 /100 | #65 | Exceptional $105,082 |