Nicaraguan vs Blackfeet Median Female Earnings
COMPARE
Nicaraguan
Blackfeet
Median Female Earnings
Median Female Earnings Comparison
Nicaraguans
Blackfeet
$36,904
MEDIAN FEMALE EARNINGS
0.3/ 100
METRIC RATING
271st/ 347
METRIC RANK
$35,864
MEDIAN FEMALE EARNINGS
0.0/ 100
METRIC RATING
291st/ 347
METRIC RANK
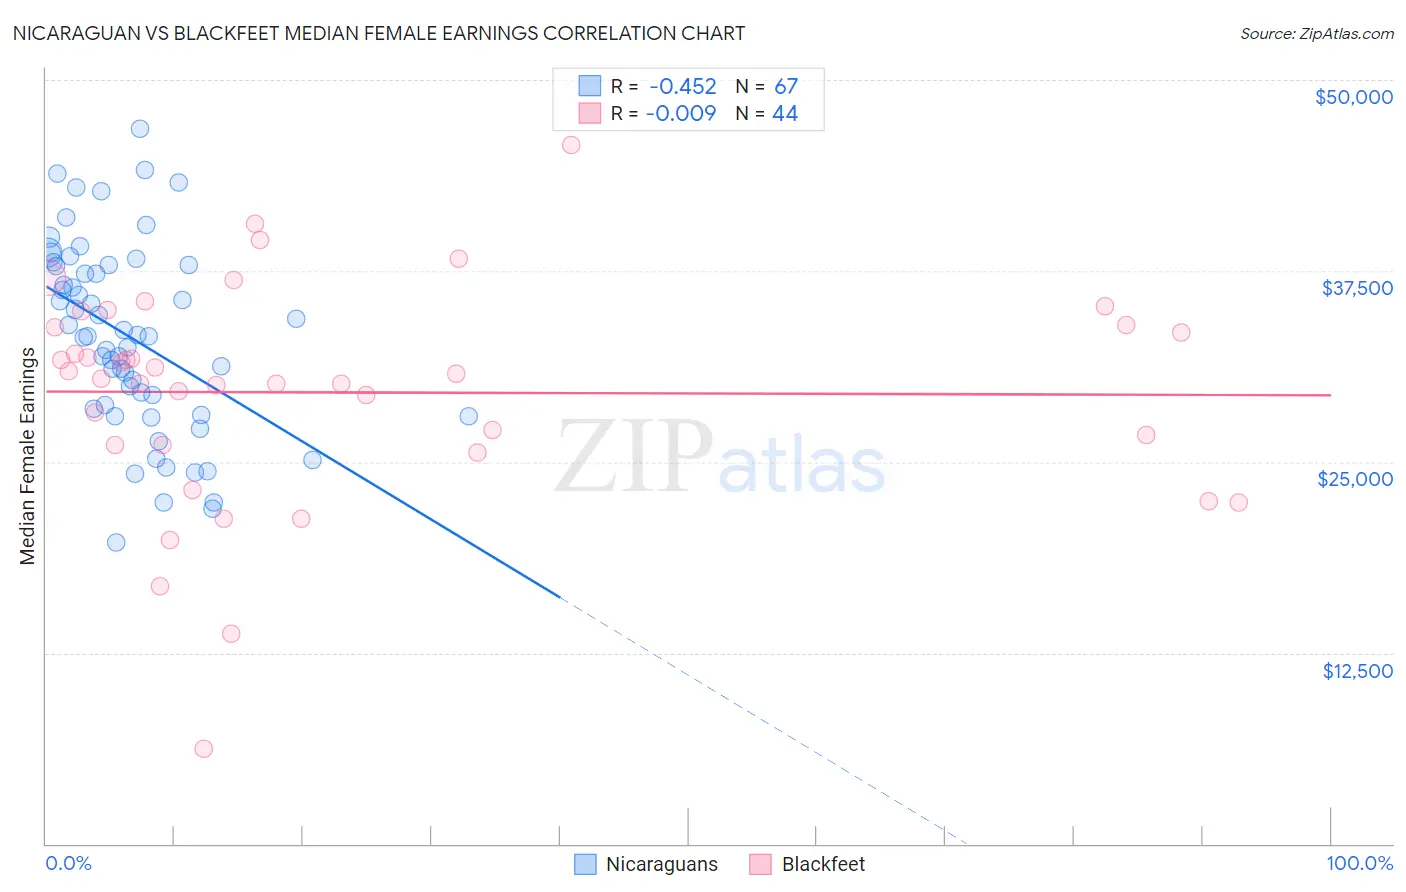
Nicaraguan vs Blackfeet Median Female Earnings Correlation Chart
The statistical analysis conducted on geographies consisting of 285,562,619 people shows a moderate negative correlation between the proportion of Nicaraguans and median female earnings in the United States with a correlation coefficient (R) of -0.452 and weighted average of $36,904. Similarly, the statistical analysis conducted on geographies consisting of 309,402,871 people shows no correlation between the proportion of Blackfeet and median female earnings in the United States with a correlation coefficient (R) of -0.009 and weighted average of $35,864, a difference of 2.9%.
Median Female Earnings Correlation Summary
| Measurement | Nicaraguan | Blackfeet |
| Minimum | $19,750 | $6,250 |
| Maximum | $46,802 | $45,714 |
| Range | $27,052 | $39,464 |
| Mean | $33,153 | $29,547 |
| Median | $33,262 | $30,603 |
| Interquartile 25% (IQ1) | $28,501 | $26,095 |
| Interquartile 75% (IQ3) | $37,900 | $33,875 |
| Interquartile Range (IQR) | $9,399 | $7,780 |
| Standard Deviation (Sample) | $6,142 | $7,260 |
| Standard Deviation (Population) | $6,096 | $7,177 |
Demographics Similar to Nicaraguans and Blackfeet by Median Female Earnings
In terms of median female earnings, the demographic groups most similar to Nicaraguans are Immigrants from Dominican Republic ($36,857, a difference of 0.13%), Immigrants from Laos ($36,841, a difference of 0.17%), Immigrants from El Salvador ($36,673, a difference of 0.63%), African ($36,530, a difference of 1.0%), and Central American ($36,492, a difference of 1.1%). Similarly, the demographic groups most similar to Blackfeet are Central American Indian ($35,930, a difference of 0.18%), Bangladeshi ($35,960, a difference of 0.27%), Immigrants from Zaire ($36,017, a difference of 0.43%), Immigrants from Nicaragua ($36,023, a difference of 0.44%), and Osage ($36,034, a difference of 0.47%).
| Demographics | Rating | Rank | Median Female Earnings |
| Nicaraguans | 0.3 /100 | #271 | Tragic $36,904 |
| Immigrants | Dominican Republic | 0.3 /100 | #272 | Tragic $36,857 |
| Immigrants | Laos | 0.3 /100 | #273 | Tragic $36,841 |
| Immigrants | El Salvador | 0.2 /100 | #274 | Tragic $36,673 |
| Africans | 0.1 /100 | #275 | Tragic $36,530 |
| Central Americans | 0.1 /100 | #276 | Tragic $36,492 |
| Marshallese | 0.1 /100 | #277 | Tragic $36,459 |
| U.S. Virgin Islanders | 0.1 /100 | #278 | Tragic $36,424 |
| Immigrants | Caribbean | 0.1 /100 | #279 | Tragic $36,414 |
| Iroquois | 0.1 /100 | #280 | Tragic $36,408 |
| Spanish Americans | 0.1 /100 | #281 | Tragic $36,391 |
| Haitians | 0.1 /100 | #282 | Tragic $36,374 |
| Immigrants | Haiti | 0.1 /100 | #283 | Tragic $36,203 |
| Indonesians | 0.1 /100 | #284 | Tragic $36,140 |
| Paiute | 0.1 /100 | #285 | Tragic $36,056 |
| Osage | 0.0 /100 | #286 | Tragic $36,034 |
| Immigrants | Nicaragua | 0.0 /100 | #287 | Tragic $36,023 |
| Immigrants | Zaire | 0.0 /100 | #288 | Tragic $36,017 |
| Bangladeshis | 0.0 /100 | #289 | Tragic $35,960 |
| Central American Indians | 0.0 /100 | #290 | Tragic $35,930 |
| Blackfeet | 0.0 /100 | #291 | Tragic $35,864 |