Crow vs Tlingit-Haida Householder Income Ages 25 - 44 years
COMPARE
Crow
Tlingit-Haida
Householder Income Ages 25 - 44 years
Householder Income Ages 25 - 44 years Comparison
Crow
Tlingit-Haida
$71,337
HOUSEHOLDER INCOME AGES 25 - 44 YEARS
0.0/ 100
METRIC RATING
342nd/ 347
METRIC RANK
$92,987
HOUSEHOLDER INCOME AGES 25 - 44 YEARS
29.4/ 100
METRIC RATING
191st/ 347
METRIC RANK
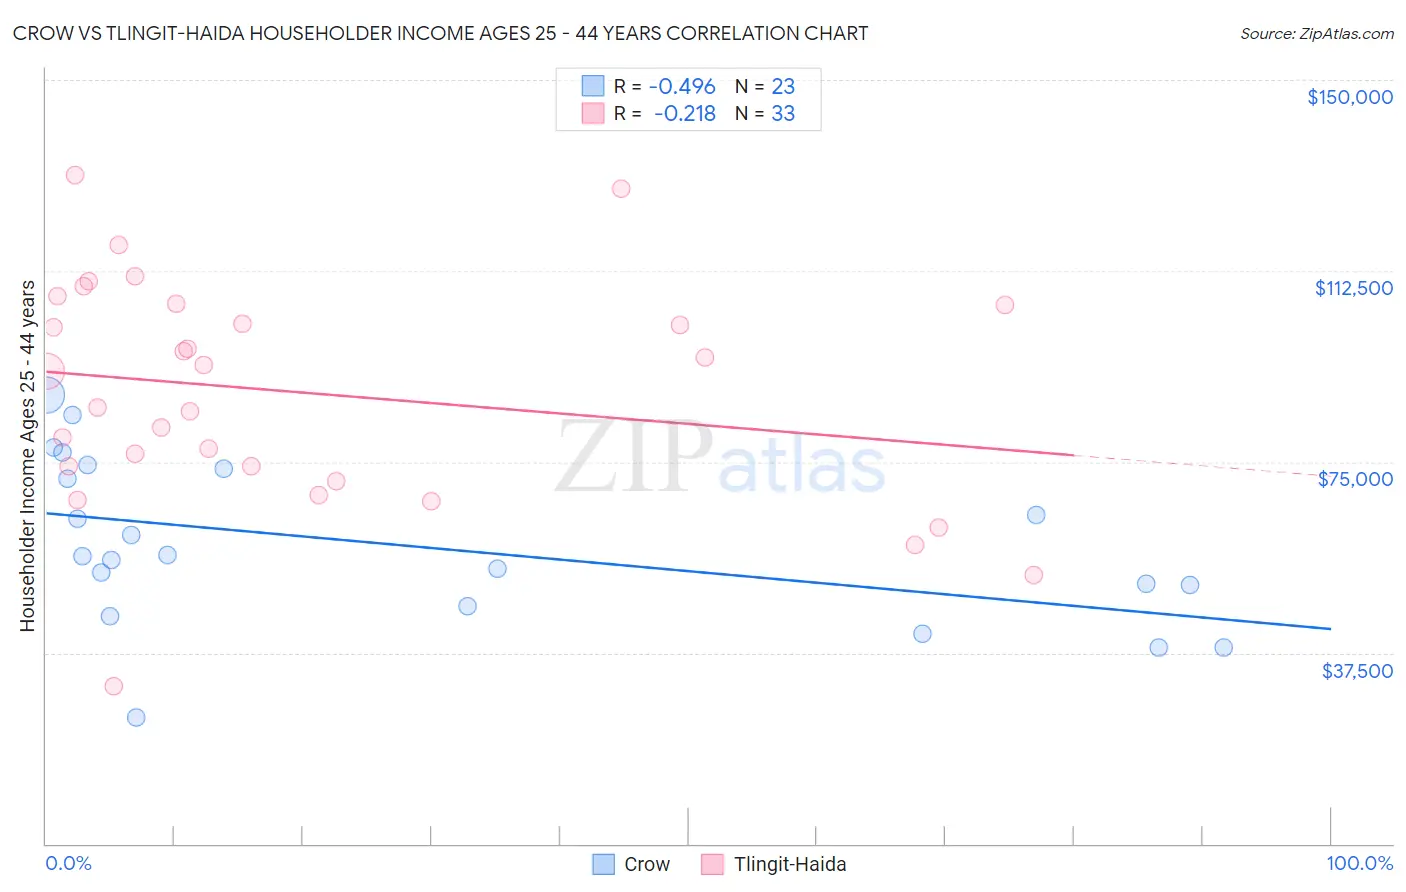
Crow vs Tlingit-Haida Householder Income Ages 25 - 44 years Correlation Chart
The statistical analysis conducted on geographies consisting of 59,146,182 people shows a moderate negative correlation between the proportion of Crow and household income with householder between the ages 25 and 44 in the United States with a correlation coefficient (R) of -0.496 and weighted average of $71,337. Similarly, the statistical analysis conducted on geographies consisting of 60,815,061 people shows a weak negative correlation between the proportion of Tlingit-Haida and household income with householder between the ages 25 and 44 in the United States with a correlation coefficient (R) of -0.218 and weighted average of $92,987, a difference of 30.3%.
Householder Income Ages 25 - 44 years Correlation Summary
| Measurement | Crow | Tlingit-Haida |
| Minimum | $24,750 | $30,938 |
| Maximum | $88,221 | $131,395 |
| Range | $63,471 | $100,457 |
| Mean | $58,648 | $88,610 |
| Median | $56,586 | $92,732 |
| Interquartile 25% (IQ1) | $46,651 | $72,697 |
| Interquartile 75% (IQ3) | $73,750 | $105,957 |
| Interquartile Range (IQR) | $27,099 | $33,260 |
| Standard Deviation (Sample) | $16,111 | $22,410 |
| Standard Deviation (Population) | $15,756 | $22,068 |
Similar Demographics by Householder Income Ages 25 - 44 years
Demographics Similar to Crow by Householder Income Ages 25 - 44 years
In terms of householder income ages 25 - 44 years, the demographic groups most similar to Crow are Arapaho ($71,697, a difference of 0.50%), Immigrants from Congo ($72,178, a difference of 1.2%), Yuman ($72,956, a difference of 2.3%), Immigrants from Yemen ($73,043, a difference of 2.4%), and Black/African American ($73,370, a difference of 2.9%).
| Demographics | Rating | Rank | Householder Income Ages 25 - 44 years |
| Hopi | 0.0 /100 | #333 | Tragic $75,002 |
| Creek | 0.0 /100 | #334 | Tragic $74,847 |
| Kiowa | 0.0 /100 | #335 | Tragic $74,776 |
| Yup'ik | 0.0 /100 | #336 | Tragic $73,688 |
| Blacks/African Americans | 0.0 /100 | #337 | Tragic $73,370 |
| Immigrants | Yemen | 0.0 /100 | #338 | Tragic $73,043 |
| Yuman | 0.0 /100 | #339 | Tragic $72,956 |
| Immigrants | Congo | 0.0 /100 | #340 | Tragic $72,178 |
| Arapaho | 0.0 /100 | #341 | Tragic $71,697 |
| Crow | 0.0 /100 | #342 | Tragic $71,337 |
| Tohono O'odham | 0.0 /100 | #343 | Tragic $69,068 |
| Pueblo | 0.0 /100 | #344 | Tragic $68,910 |
| Navajo | 0.0 /100 | #345 | Tragic $66,529 |
| Puerto Ricans | 0.0 /100 | #346 | Tragic $65,996 |
| Lumbee | 0.0 /100 | #347 | Tragic $60,305 |
Demographics Similar to Tlingit-Haida by Householder Income Ages 25 - 44 years
In terms of householder income ages 25 - 44 years, the demographic groups most similar to Tlingit-Haida are Welsh ($93,039, a difference of 0.060%), Dutch ($93,081, a difference of 0.10%), Immigrants from Costa Rica ($92,876, a difference of 0.12%), Immigrants from Sierra Leone ($93,115, a difference of 0.14%), and Spaniard ($93,366, a difference of 0.41%).
| Demographics | Rating | Rank | Householder Income Ages 25 - 44 years |
| Germans | 36.0 /100 | #184 | Fair $93,531 |
| Immigrants | Eritrea | 35.2 /100 | #185 | Fair $93,466 |
| Sierra Leoneans | 34.8 /100 | #186 | Fair $93,435 |
| Spaniards | 34.0 /100 | #187 | Fair $93,366 |
| Immigrants | Sierra Leone | 30.9 /100 | #188 | Fair $93,115 |
| Dutch | 30.5 /100 | #189 | Fair $93,081 |
| Welsh | 30.0 /100 | #190 | Fair $93,039 |
| Tlingit-Haida | 29.4 /100 | #191 | Fair $92,987 |
| Immigrants | Costa Rica | 28.2 /100 | #192 | Fair $92,876 |
| Samoans | 23.0 /100 | #193 | Fair $92,385 |
| Immigrants | Azores | 22.4 /100 | #194 | Fair $92,322 |
| Celtics | 21.6 /100 | #195 | Fair $92,241 |
| Immigrants | Colombia | 21.3 /100 | #196 | Fair $92,204 |
| Spanish | 21.2 /100 | #197 | Fair $92,200 |
| Vietnamese | 20.2 /100 | #198 | Fair $92,089 |