Crow vs Immigrants from Somalia Householder Income Ages 25 - 44 years
COMPARE
Crow
Immigrants from Somalia
Householder Income Ages 25 - 44 years
Householder Income Ages 25 - 44 years Comparison
Crow
Immigrants from Somalia
$71,337
HOUSEHOLDER INCOME AGES 25 - 44 YEARS
0.0/ 100
METRIC RATING
342nd/ 347
METRIC RANK
$82,188
HOUSEHOLDER INCOME AGES 25 - 44 YEARS
0.1/ 100
METRIC RATING
285th/ 347
METRIC RANK
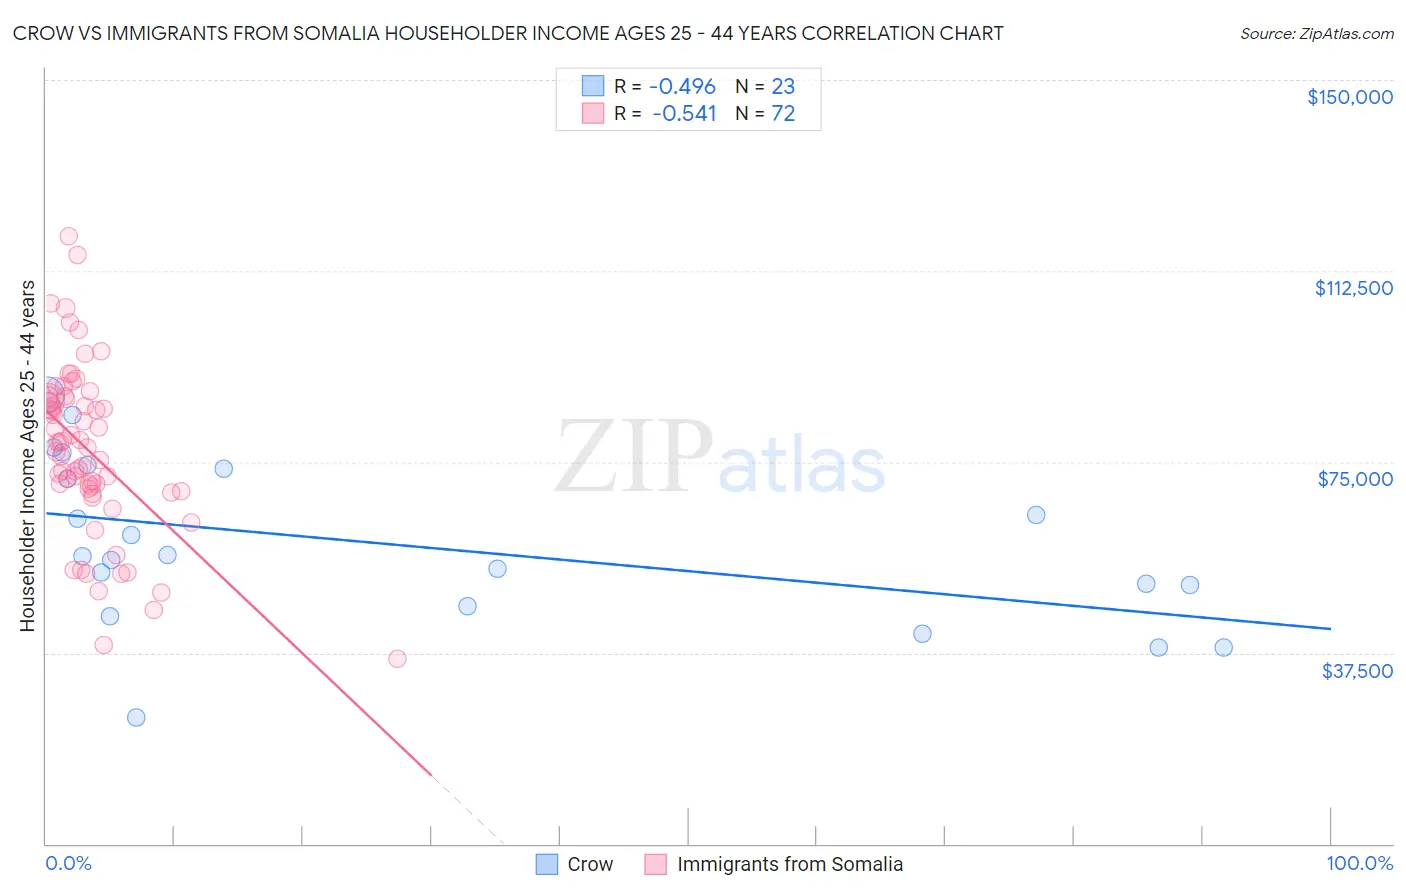
Crow vs Immigrants from Somalia Householder Income Ages 25 - 44 years Correlation Chart
The statistical analysis conducted on geographies consisting of 59,146,182 people shows a moderate negative correlation between the proportion of Crow and household income with householder between the ages 25 and 44 in the United States with a correlation coefficient (R) of -0.496 and weighted average of $71,337. Similarly, the statistical analysis conducted on geographies consisting of 92,085,049 people shows a substantial negative correlation between the proportion of Immigrants from Somalia and household income with householder between the ages 25 and 44 in the United States with a correlation coefficient (R) of -0.541 and weighted average of $82,188, a difference of 15.2%.
Householder Income Ages 25 - 44 years Correlation Summary
| Measurement | Crow | Immigrants from Somalia |
| Minimum | $24,750 | $36,409 |
| Maximum | $88,221 | $119,233 |
| Range | $63,471 | $82,824 |
| Mean | $58,648 | $77,251 |
| Median | $56,586 | $78,315 |
| Interquartile 25% (IQ1) | $46,651 | $69,397 |
| Interquartile 75% (IQ3) | $73,750 | $87,226 |
| Interquartile Range (IQR) | $27,099 | $17,829 |
| Standard Deviation (Sample) | $16,111 | $16,543 |
| Standard Deviation (Population) | $15,756 | $16,428 |
Similar Demographics by Householder Income Ages 25 - 44 years
Demographics Similar to Crow by Householder Income Ages 25 - 44 years
In terms of householder income ages 25 - 44 years, the demographic groups most similar to Crow are Arapaho ($71,697, a difference of 0.50%), Immigrants from Congo ($72,178, a difference of 1.2%), Yuman ($72,956, a difference of 2.3%), Immigrants from Yemen ($73,043, a difference of 2.4%), and Black/African American ($73,370, a difference of 2.9%).
| Demographics | Rating | Rank | Householder Income Ages 25 - 44 years |
| Hopi | 0.0 /100 | #333 | Tragic $75,002 |
| Creek | 0.0 /100 | #334 | Tragic $74,847 |
| Kiowa | 0.0 /100 | #335 | Tragic $74,776 |
| Yup'ik | 0.0 /100 | #336 | Tragic $73,688 |
| Blacks/African Americans | 0.0 /100 | #337 | Tragic $73,370 |
| Immigrants | Yemen | 0.0 /100 | #338 | Tragic $73,043 |
| Yuman | 0.0 /100 | #339 | Tragic $72,956 |
| Immigrants | Congo | 0.0 /100 | #340 | Tragic $72,178 |
| Arapaho | 0.0 /100 | #341 | Tragic $71,697 |
| Crow | 0.0 /100 | #342 | Tragic $71,337 |
| Tohono O'odham | 0.0 /100 | #343 | Tragic $69,068 |
| Pueblo | 0.0 /100 | #344 | Tragic $68,910 |
| Navajo | 0.0 /100 | #345 | Tragic $66,529 |
| Puerto Ricans | 0.0 /100 | #346 | Tragic $65,996 |
| Lumbee | 0.0 /100 | #347 | Tragic $60,305 |
Demographics Similar to Immigrants from Somalia by Householder Income Ages 25 - 44 years
In terms of householder income ages 25 - 44 years, the demographic groups most similar to Immigrants from Somalia are Ute ($82,166, a difference of 0.030%), Immigrants from Latin America ($82,166, a difference of 0.030%), Comanche ($82,152, a difference of 0.040%), Immigrants from Middle Africa ($82,254, a difference of 0.080%), and Shoshone ($82,062, a difference of 0.15%).
| Demographics | Rating | Rank | Householder Income Ages 25 - 44 years |
| Senegalese | 0.2 /100 | #278 | Tragic $82,852 |
| Pima | 0.1 /100 | #279 | Tragic $82,821 |
| Colville | 0.1 /100 | #280 | Tragic $82,604 |
| Cajuns | 0.1 /100 | #281 | Tragic $82,393 |
| Central American Indians | 0.1 /100 | #282 | Tragic $82,355 |
| Guatemalans | 0.1 /100 | #283 | Tragic $82,331 |
| Immigrants | Middle Africa | 0.1 /100 | #284 | Tragic $82,254 |
| Immigrants | Somalia | 0.1 /100 | #285 | Tragic $82,188 |
| Ute | 0.1 /100 | #286 | Tragic $82,166 |
| Immigrants | Latin America | 0.1 /100 | #287 | Tragic $82,166 |
| Comanche | 0.1 /100 | #288 | Tragic $82,152 |
| Shoshone | 0.1 /100 | #289 | Tragic $82,062 |
| Liberians | 0.1 /100 | #290 | Tragic $82,005 |
| Potawatomi | 0.1 /100 | #291 | Tragic $81,774 |
| Yaqui | 0.1 /100 | #292 | Tragic $81,656 |