Crow vs Colville Householder Income Over 65 years
COMPARE
Crow
Colville
Householder Income Over 65 years
Householder Income Over 65 years Comparison
Crow
Colville
$49,234
HOUSEHOLDER INCOME OVER 65 YEARS
0.0/ 100
METRIC RATING
335th/ 347
METRIC RANK
$51,739
HOUSEHOLDER INCOME OVER 65 YEARS
0.0/ 100
METRIC RATING
320th/ 347
METRIC RANK
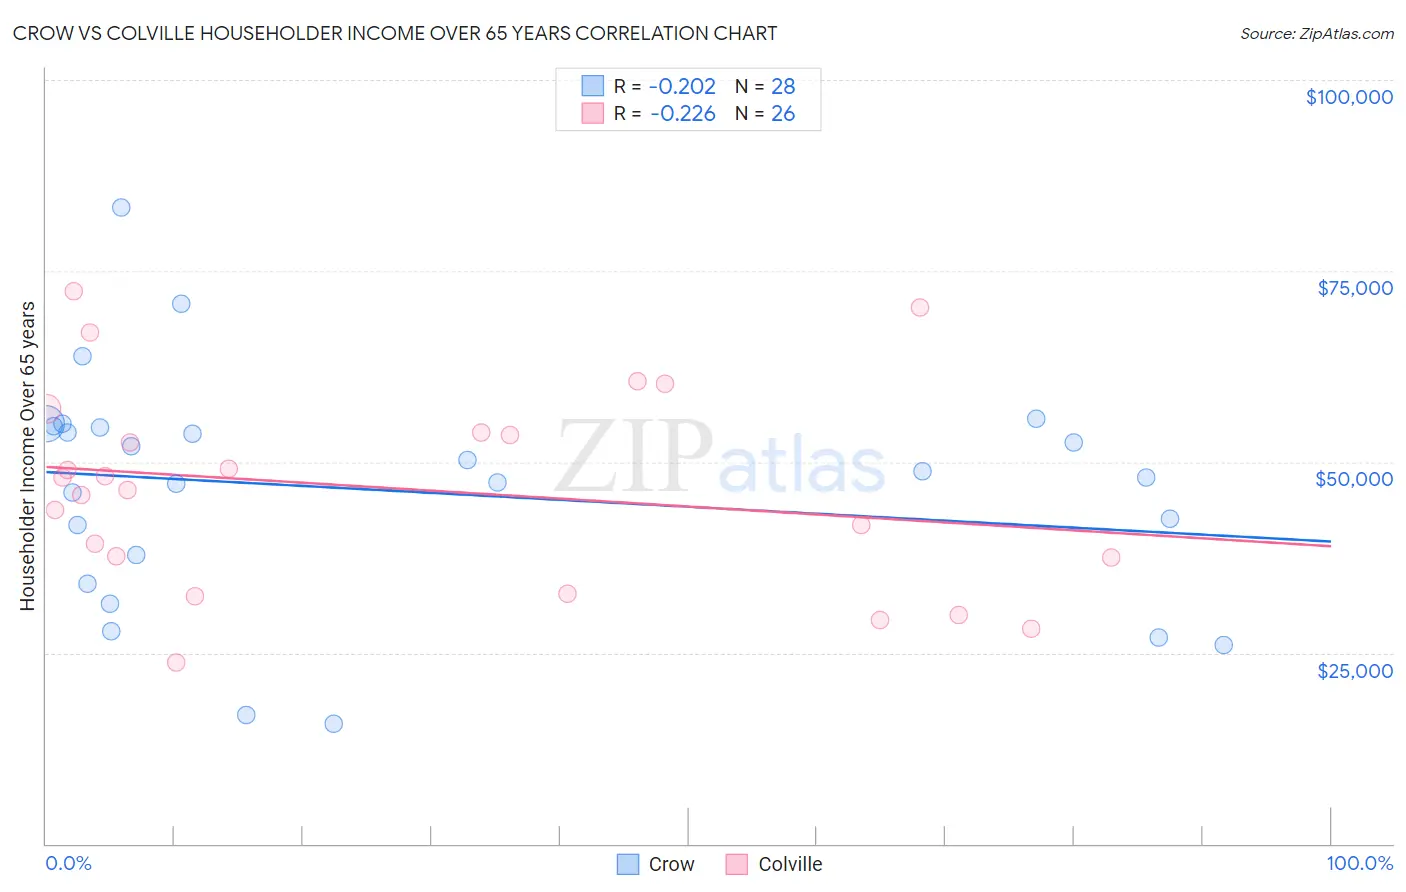
Crow vs Colville Householder Income Over 65 years Correlation Chart
The statistical analysis conducted on geographies consisting of 59,087,970 people shows a weak negative correlation between the proportion of Crow and household income with householder over the age of 65 in the United States with a correlation coefficient (R) of -0.202 and weighted average of $49,234. Similarly, the statistical analysis conducted on geographies consisting of 34,655,374 people shows a weak negative correlation between the proportion of Colville and household income with householder over the age of 65 in the United States with a correlation coefficient (R) of -0.226 and weighted average of $51,739, a difference of 5.1%.
Householder Income Over 65 years Correlation Summary
| Measurement | Crow | Colville |
| Minimum | $15,714 | $23,676 |
| Maximum | $83,321 | $72,281 |
| Range | $67,607 | $48,605 |
| Mean | $46,192 | $46,521 |
| Median | $48,334 | $47,145 |
| Interquartile 25% (IQ1) | $35,989 | $37,500 |
| Interquartile 75% (IQ3) | $54,581 | $53,832 |
| Interquartile Range (IQR) | $18,592 | $16,332 |
| Standard Deviation (Sample) | $15,233 | $13,193 |
| Standard Deviation (Population) | $14,959 | $12,937 |
Demographics Similar to Crow and Colville by Householder Income Over 65 years
In terms of householder income over 65 years, the demographic groups most similar to Crow are Cuban ($49,152, a difference of 0.17%), Tohono O'odham ($49,121, a difference of 0.23%), Immigrants from Dominica ($50,071, a difference of 1.7%), Cape Verdean ($50,077, a difference of 1.7%), and Dutch West Indian ($50,475, a difference of 2.5%). Similarly, the demographic groups most similar to Colville are Menominee ($51,719, a difference of 0.040%), Immigrants from Honduras ($51,888, a difference of 0.29%), Haitian ($51,912, a difference of 0.33%), Immigrants from St. Vincent and the Grenadines ($51,922, a difference of 0.35%), and British West Indian ($51,463, a difference of 0.54%).
| Demographics | Rating | Rank | Householder Income Over 65 years |
| Immigrants | St. Vincent and the Grenadines | 0.0 /100 | #317 | Tragic $51,922 |
| Haitians | 0.0 /100 | #318 | Tragic $51,912 |
| Immigrants | Honduras | 0.0 /100 | #319 | Tragic $51,888 |
| Colville | 0.0 /100 | #320 | Tragic $51,739 |
| Menominee | 0.0 /100 | #321 | Tragic $51,719 |
| British West Indians | 0.0 /100 | #322 | Tragic $51,463 |
| Cajuns | 0.0 /100 | #323 | Tragic $51,397 |
| Immigrants | Congo | 0.0 /100 | #324 | Tragic $51,393 |
| Immigrants | Haiti | 0.0 /100 | #325 | Tragic $51,219 |
| Kiowa | 0.0 /100 | #326 | Tragic $51,140 |
| Bahamians | 0.0 /100 | #327 | Tragic $51,000 |
| Hopi | 0.0 /100 | #328 | Tragic $50,925 |
| Blacks/African Americans | 0.0 /100 | #329 | Tragic $50,779 |
| Immigrants | Grenada | 0.0 /100 | #330 | Tragic $50,747 |
| Pima | 0.0 /100 | #331 | Tragic $50,539 |
| Dutch West Indians | 0.0 /100 | #332 | Tragic $50,475 |
| Cape Verdeans | 0.0 /100 | #333 | Tragic $50,077 |
| Immigrants | Dominica | 0.0 /100 | #334 | Tragic $50,071 |
| Crow | 0.0 /100 | #335 | Tragic $49,234 |
| Cubans | 0.0 /100 | #336 | Tragic $49,152 |
| Tohono O'odham | 0.0 /100 | #337 | Tragic $49,121 |