Crow vs Albanian Householder Income Over 65 years
COMPARE
Crow
Albanian
Householder Income Over 65 years
Householder Income Over 65 years Comparison
Crow
Albanians
$49,234
HOUSEHOLDER INCOME OVER 65 YEARS
0.0/ 100
METRIC RATING
335th/ 347
METRIC RANK
$60,249
HOUSEHOLDER INCOME OVER 65 YEARS
32.0/ 100
METRIC RATING
185th/ 347
METRIC RANK
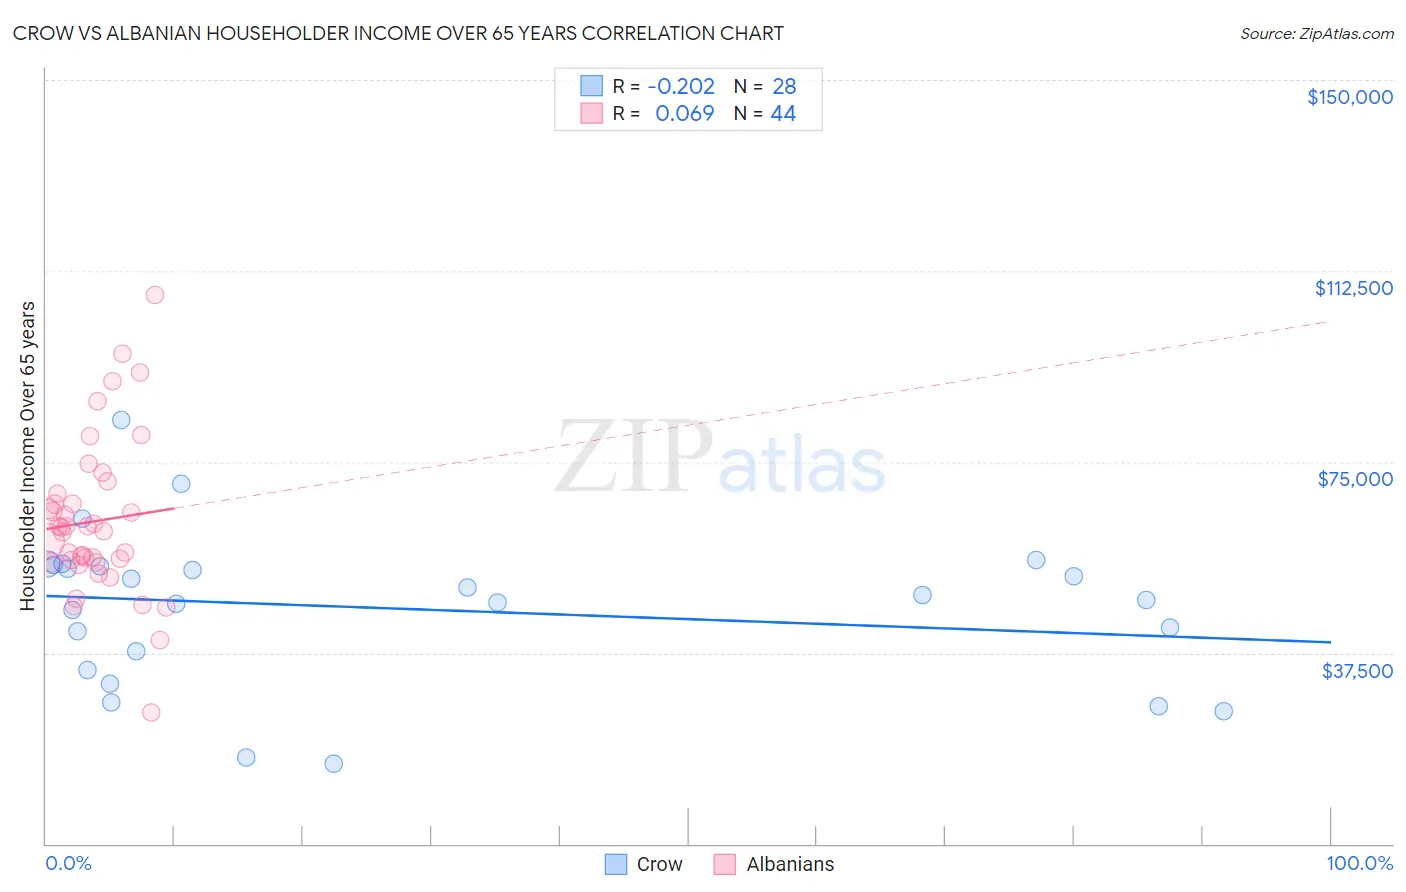
Crow vs Albanian Householder Income Over 65 years Correlation Chart
The statistical analysis conducted on geographies consisting of 59,087,970 people shows a weak negative correlation between the proportion of Crow and household income with householder over the age of 65 in the United States with a correlation coefficient (R) of -0.202 and weighted average of $49,234. Similarly, the statistical analysis conducted on geographies consisting of 192,894,684 people shows a slight positive correlation between the proportion of Albanians and household income with householder over the age of 65 in the United States with a correlation coefficient (R) of 0.069 and weighted average of $60,249, a difference of 22.4%.
Householder Income Over 65 years Correlation Summary
| Measurement | Crow | Albanian |
| Minimum | $15,714 | $25,833 |
| Maximum | $83,321 | $107,661 |
| Range | $67,607 | $81,828 |
| Mean | $46,192 | $63,338 |
| Median | $48,334 | $61,807 |
| Interquartile 25% (IQ1) | $35,989 | $55,515 |
| Interquartile 75% (IQ3) | $54,581 | $67,768 |
| Interquartile Range (IQR) | $18,592 | $12,253 |
| Standard Deviation (Sample) | $15,233 | $15,246 |
| Standard Deviation (Population) | $14,959 | $15,071 |
Similar Demographics by Householder Income Over 65 years
Demographics Similar to Crow by Householder Income Over 65 years
In terms of householder income over 65 years, the demographic groups most similar to Crow are Cuban ($49,152, a difference of 0.17%), Tohono O'odham ($49,121, a difference of 0.23%), Immigrants from Caribbean ($48,535, a difference of 1.4%), Immigrants from Dominica ($50,071, a difference of 1.7%), and Cape Verdean ($50,077, a difference of 1.7%).
| Demographics | Rating | Rank | Householder Income Over 65 years |
| Hopi | 0.0 /100 | #328 | Tragic $50,925 |
| Blacks/African Americans | 0.0 /100 | #329 | Tragic $50,779 |
| Immigrants | Grenada | 0.0 /100 | #330 | Tragic $50,747 |
| Pima | 0.0 /100 | #331 | Tragic $50,539 |
| Dutch West Indians | 0.0 /100 | #332 | Tragic $50,475 |
| Cape Verdeans | 0.0 /100 | #333 | Tragic $50,077 |
| Immigrants | Dominica | 0.0 /100 | #334 | Tragic $50,071 |
| Crow | 0.0 /100 | #335 | Tragic $49,234 |
| Cubans | 0.0 /100 | #336 | Tragic $49,152 |
| Tohono O'odham | 0.0 /100 | #337 | Tragic $49,121 |
| Immigrants | Caribbean | 0.0 /100 | #338 | Tragic $48,535 |
| Navajo | 0.0 /100 | #339 | Tragic $47,722 |
| Immigrants | Yemen | 0.0 /100 | #340 | Tragic $47,527 |
| Dominicans | 0.0 /100 | #341 | Tragic $46,964 |
| Immigrants | Cabo Verde | 0.0 /100 | #342 | Tragic $46,654 |
Demographics Similar to Albanians by Householder Income Over 65 years
In terms of householder income over 65 years, the demographic groups most similar to Albanians are Slovene ($60,241, a difference of 0.010%), Immigrants from Thailand ($60,217, a difference of 0.050%), Immigrants from Eritrea ($60,096, a difference of 0.26%), Ghanaian ($60,043, a difference of 0.34%), and Iraqi ($60,466, a difference of 0.36%).
| Demographics | Rating | Rank | Householder Income Over 65 years |
| Yup'ik | 43.7 /100 | #178 | Average $60,727 |
| Welsh | 42.2 /100 | #179 | Average $60,666 |
| Immigrants | Morocco | 41.7 /100 | #180 | Average $60,647 |
| Celtics | 40.7 /100 | #181 | Average $60,608 |
| Czechoslovakians | 40.0 /100 | #182 | Average $60,581 |
| Kenyans | 38.4 /100 | #183 | Fair $60,514 |
| Iraqis | 37.2 /100 | #184 | Fair $60,466 |
| Albanians | 32.0 /100 | #185 | Fair $60,249 |
| Slovenes | 31.8 /100 | #186 | Fair $60,241 |
| Immigrants | Thailand | 31.3 /100 | #187 | Fair $60,217 |
| Immigrants | Eritrea | 28.6 /100 | #188 | Fair $60,096 |
| Ghanaians | 27.5 /100 | #189 | Fair $60,043 |
| Puget Sound Salish | 25.3 /100 | #190 | Fair $59,934 |
| Belgians | 24.9 /100 | #191 | Fair $59,915 |
| South Americans | 23.8 /100 | #192 | Fair $59,854 |