Crow vs Immigrants from Japan Per Capita Income
COMPARE
Crow
Immigrants from Japan
Per Capita Income
Per Capita Income Comparison
Crow
Immigrants from Japan
$31,729
PER CAPITA INCOME
0.0/ 100
METRIC RATING
340th/ 347
METRIC RANK
$53,359
PER CAPITA INCOME
100.0/ 100
METRIC RATING
25th/ 347
METRIC RANK
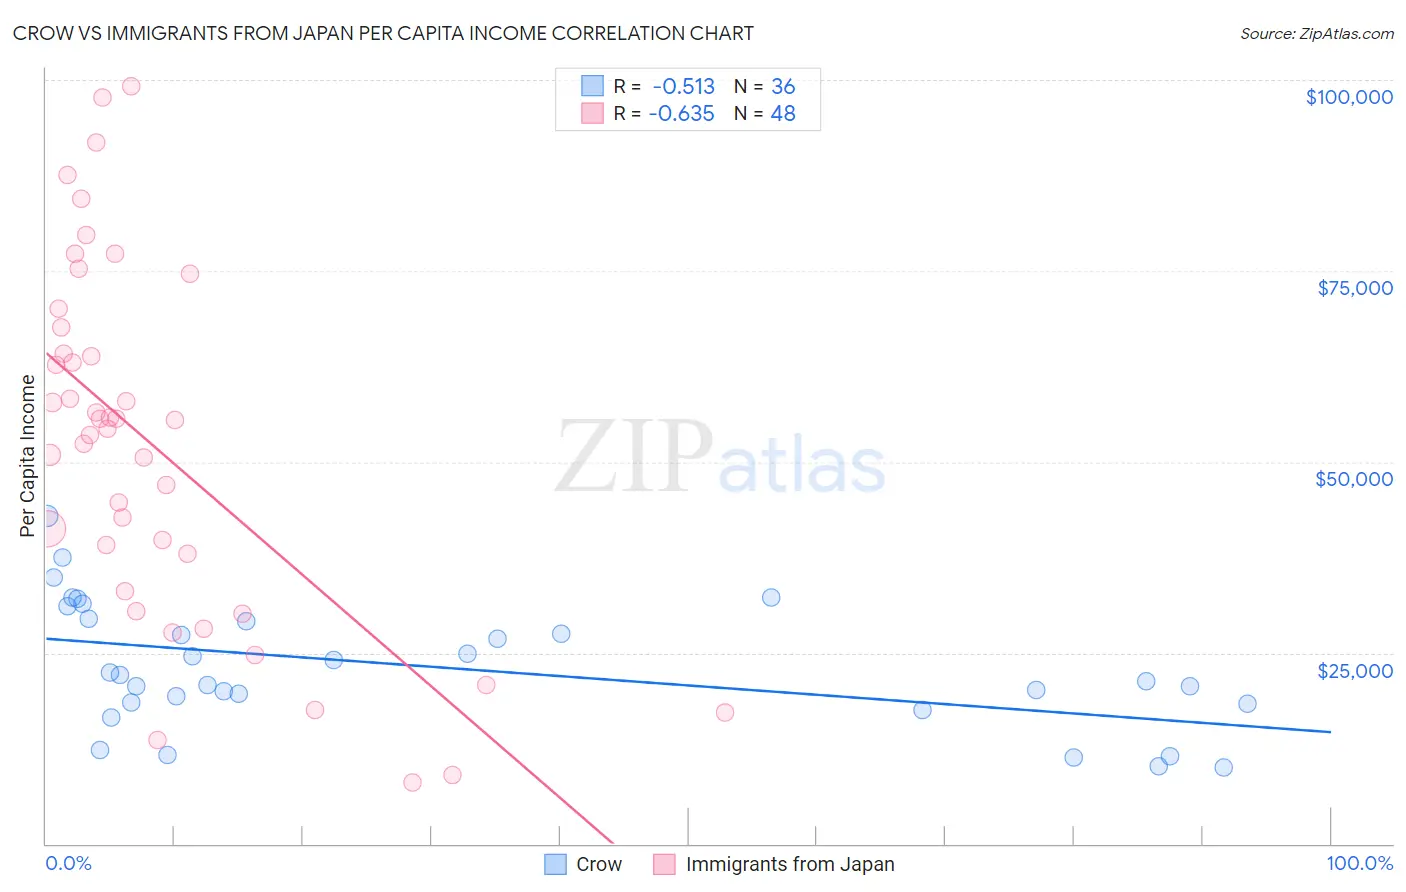
Crow vs Immigrants from Japan Per Capita Income Correlation Chart
The statistical analysis conducted on geographies consisting of 59,209,980 people shows a substantial negative correlation between the proportion of Crow and per capita income in the United States with a correlation coefficient (R) of -0.513 and weighted average of $31,729. Similarly, the statistical analysis conducted on geographies consisting of 340,161,368 people shows a significant negative correlation between the proportion of Immigrants from Japan and per capita income in the United States with a correlation coefficient (R) of -0.635 and weighted average of $53,359, a difference of 68.2%.
Per Capita Income Correlation Summary
| Measurement | Crow | Immigrants from Japan |
| Minimum | $9,914 | $8,097 |
| Maximum | $42,917 | $99,130 |
| Range | $33,003 | $91,033 |
| Mean | $23,129 | $52,166 |
| Median | $21,705 | $54,914 |
| Interquartile 25% (IQ1) | $18,390 | $35,570 |
| Interquartile 75% (IQ3) | $29,346 | $65,919 |
| Interquartile Range (IQR) | $10,956 | $30,349 |
| Standard Deviation (Sample) | $8,112 | $23,163 |
| Standard Deviation (Population) | $7,999 | $22,920 |
Similar Demographics by Per Capita Income
Demographics Similar to Crow by Per Capita Income
In terms of per capita income, the demographic groups most similar to Crow are Pueblo ($32,012, a difference of 0.89%), Puerto Rican ($31,268, a difference of 1.5%), Hopi ($31,177, a difference of 1.8%), Arapaho ($32,345, a difference of 1.9%), and Pima ($30,644, a difference of 3.5%).
| Demographics | Rating | Rank | Per Capita Income |
| Immigrants | Yemen | 0.0 /100 | #333 | Tragic $33,696 |
| Natives/Alaskans | 0.0 /100 | #334 | Tragic $33,279 |
| Yuman | 0.0 /100 | #335 | Tragic $33,236 |
| Yakama | 0.0 /100 | #336 | Tragic $33,009 |
| Houma | 0.0 /100 | #337 | Tragic $32,996 |
| Arapaho | 0.0 /100 | #338 | Tragic $32,345 |
| Pueblo | 0.0 /100 | #339 | Tragic $32,012 |
| Crow | 0.0 /100 | #340 | Tragic $31,729 |
| Puerto Ricans | 0.0 /100 | #341 | Tragic $31,268 |
| Hopi | 0.0 /100 | #342 | Tragic $31,177 |
| Pima | 0.0 /100 | #343 | Tragic $30,644 |
| Yup'ik | 0.0 /100 | #344 | Tragic $30,518 |
| Tohono O'odham | 0.0 /100 | #345 | Tragic $30,256 |
| Lumbee | 0.0 /100 | #346 | Tragic $29,845 |
| Navajo | 0.0 /100 | #347 | Tragic $29,031 |
Demographics Similar to Immigrants from Japan by Per Capita Income
In terms of per capita income, the demographic groups most similar to Immigrants from Japan are Russian ($53,154, a difference of 0.39%), Immigrants from Denmark ($53,799, a difference of 0.82%), Immigrants from Eastern Asia ($53,806, a difference of 0.84%), Indian (Asian) ($53,874, a difference of 0.97%), and Immigrants from South Central Asia ($52,660, a difference of 1.3%).
| Demographics | Rating | Rank | Per Capita Income |
| Thais | 100.0 /100 | #18 | Exceptional $54,307 |
| Immigrants | China | 100.0 /100 | #19 | Exceptional $54,264 |
| Soviet Union | 100.0 /100 | #20 | Exceptional $54,202 |
| Immigrants | Northern Europe | 100.0 /100 | #21 | Exceptional $54,159 |
| Indians (Asian) | 100.0 /100 | #22 | Exceptional $53,874 |
| Immigrants | Eastern Asia | 100.0 /100 | #23 | Exceptional $53,806 |
| Immigrants | Denmark | 100.0 /100 | #24 | Exceptional $53,799 |
| Immigrants | Japan | 100.0 /100 | #25 | Exceptional $53,359 |
| Russians | 100.0 /100 | #26 | Exceptional $53,154 |
| Immigrants | South Central Asia | 100.0 /100 | #27 | Exceptional $52,660 |
| Latvians | 100.0 /100 | #28 | Exceptional $52,649 |
| Israelis | 100.0 /100 | #29 | Exceptional $52,596 |
| Immigrants | Austria | 100.0 /100 | #30 | Exceptional $52,503 |
| Turks | 100.0 /100 | #31 | Exceptional $52,391 |
| Immigrants | Norway | 100.0 /100 | #32 | Exceptional $52,217 |