Immigrants from Oceania vs Immigrants from Russia Median Male Earnings
COMPARE
Immigrants from Oceania
Immigrants from Russia
Median Male Earnings
Median Male Earnings Comparison
Immigrants from Oceania
Immigrants from Russia
$55,712
MEDIAN MALE EARNINGS
76.8/ 100
METRIC RATING
151st/ 347
METRIC RANK
$63,326
MEDIAN MALE EARNINGS
100.0/ 100
METRIC RATING
34th/ 347
METRIC RANK
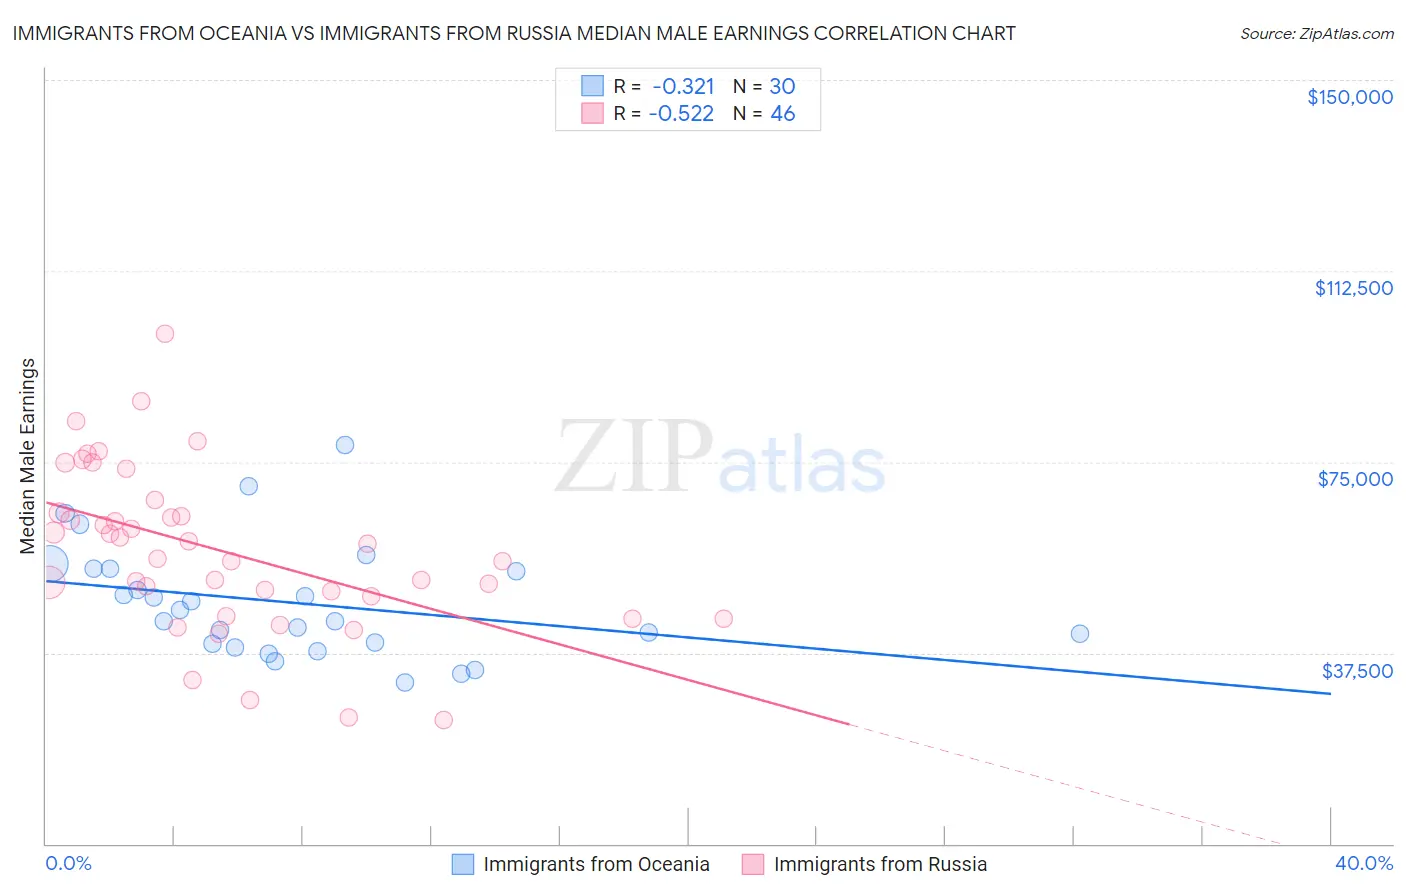
Immigrants from Oceania vs Immigrants from Russia Median Male Earnings Correlation Chart
The statistical analysis conducted on geographies consisting of 305,444,648 people shows a mild negative correlation between the proportion of Immigrants from Oceania and median male earnings in the United States with a correlation coefficient (R) of -0.321 and weighted average of $55,712. Similarly, the statistical analysis conducted on geographies consisting of 347,872,135 people shows a substantial negative correlation between the proportion of Immigrants from Russia and median male earnings in the United States with a correlation coefficient (R) of -0.522 and weighted average of $63,326, a difference of 13.7%.
Median Male Earnings Correlation Summary
| Measurement | Immigrants from Oceania | Immigrants from Russia |
| Minimum | $31,736 | $24,333 |
| Maximum | $78,276 | $100,126 |
| Range | $46,540 | $75,793 |
| Mean | $47,354 | $57,593 |
| Median | $44,818 | $57,441 |
| Interquartile 25% (IQ1) | $39,222 | $48,674 |
| Interquartile 75% (IQ3) | $54,011 | $65,019 |
| Interquartile Range (IQR) | $14,789 | $16,345 |
| Standard Deviation (Sample) | $11,148 | $16,130 |
| Standard Deviation (Population) | $10,961 | $15,954 |
Similar Demographics by Median Male Earnings
Demographics Similar to Immigrants from Oceania by Median Male Earnings
In terms of median male earnings, the demographic groups most similar to Immigrants from Oceania are Swiss ($55,731, a difference of 0.030%), English ($55,747, a difference of 0.060%), Peruvian ($55,659, a difference of 0.10%), Scottish ($55,793, a difference of 0.15%), and Immigrants from Philippines ($55,809, a difference of 0.17%).
| Demographics | Rating | Rank | Median Male Earnings |
| Immigrants | Uganda | 82.4 /100 | #144 | Excellent $56,064 |
| Norwegians | 80.9 /100 | #145 | Excellent $55,965 |
| Immigrants | Chile | 80.7 /100 | #146 | Excellent $55,954 |
| Immigrants | Philippines | 78.4 /100 | #147 | Good $55,809 |
| Scottish | 78.2 /100 | #148 | Good $55,793 |
| English | 77.4 /100 | #149 | Good $55,747 |
| Swiss | 77.1 /100 | #150 | Good $55,731 |
| Immigrants | Oceania | 76.8 /100 | #151 | Good $55,712 |
| Peruvians | 75.8 /100 | #152 | Good $55,659 |
| Immigrants | Nepal | 75.0 /100 | #153 | Good $55,615 |
| Taiwanese | 73.9 /100 | #154 | Good $55,556 |
| Scandinavians | 73.4 /100 | #155 | Good $55,527 |
| Immigrants | Ethiopia | 71.6 /100 | #156 | Good $55,434 |
| Icelanders | 71.2 /100 | #157 | Good $55,415 |
| Czechoslovakians | 70.5 /100 | #158 | Good $55,382 |
Demographics Similar to Immigrants from Russia by Median Male Earnings
In terms of median male earnings, the demographic groups most similar to Immigrants from Russia are Immigrants from Lithuania ($63,346, a difference of 0.030%), Soviet Union ($63,382, a difference of 0.090%), Immigrants from Asia ($63,240, a difference of 0.14%), Israeli ($63,228, a difference of 0.16%), and Latvian ($63,498, a difference of 0.27%).
| Demographics | Rating | Rank | Median Male Earnings |
| Immigrants | Switzerland | 100.0 /100 | #27 | Exceptional $63,944 |
| Russians | 100.0 /100 | #28 | Exceptional $63,939 |
| Asians | 100.0 /100 | #29 | Exceptional $63,827 |
| Immigrants | France | 100.0 /100 | #30 | Exceptional $63,715 |
| Latvians | 100.0 /100 | #31 | Exceptional $63,498 |
| Soviet Union | 100.0 /100 | #32 | Exceptional $63,382 |
| Immigrants | Lithuania | 100.0 /100 | #33 | Exceptional $63,346 |
| Immigrants | Russia | 100.0 /100 | #34 | Exceptional $63,326 |
| Immigrants | Asia | 100.0 /100 | #35 | Exceptional $63,240 |
| Israelis | 100.0 /100 | #36 | Exceptional $63,228 |
| Immigrants | Sri Lanka | 100.0 /100 | #37 | Exceptional $63,099 |
| Maltese | 100.0 /100 | #38 | Exceptional $62,953 |
| Immigrants | South Africa | 100.0 /100 | #39 | Exceptional $62,899 |
| Australians | 100.0 /100 | #40 | Exceptional $62,857 |
| Immigrants | Turkey | 100.0 /100 | #41 | Exceptional $62,728 |