Croatian vs South African Median Earnings
COMPARE
Croatian
South African
Median Earnings
Median Earnings Comparison
Croatians
South Africans
$49,724
MEDIAN EARNINGS
99.0/ 100
METRIC RATING
94th/ 347
METRIC RANK
$50,752
MEDIAN EARNINGS
99.8/ 100
METRIC RATING
74th/ 347
METRIC RANK
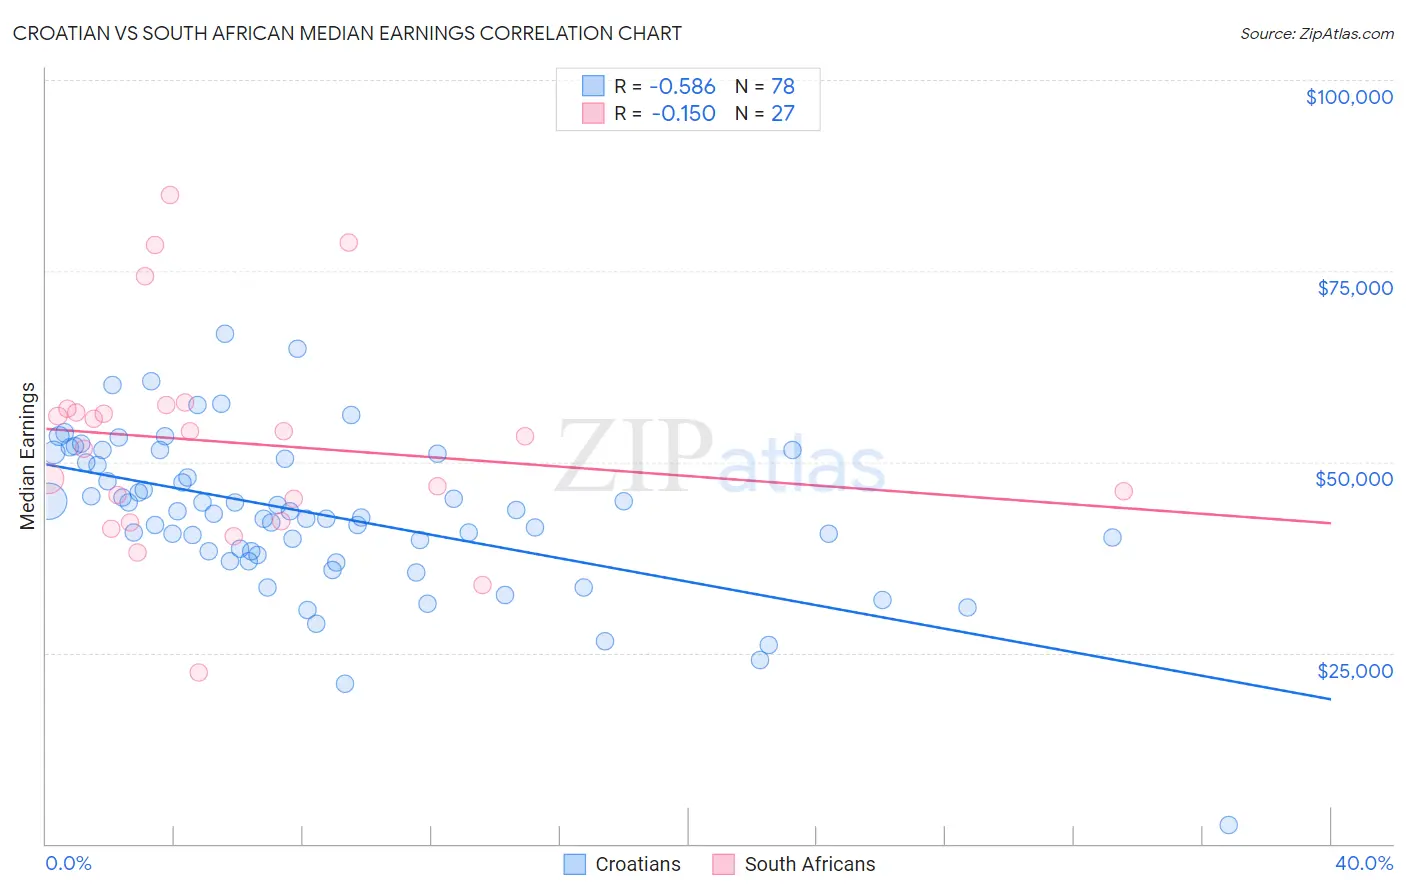
Croatian vs South African Median Earnings Correlation Chart
The statistical analysis conducted on geographies consisting of 375,721,737 people shows a substantial negative correlation between the proportion of Croatians and median earnings in the United States with a correlation coefficient (R) of -0.586 and weighted average of $49,724. Similarly, the statistical analysis conducted on geographies consisting of 182,600,845 people shows a poor negative correlation between the proportion of South Africans and median earnings in the United States with a correlation coefficient (R) of -0.150 and weighted average of $50,752, a difference of 2.1%.
Median Earnings Correlation Summary
| Measurement | Croatian | South African |
| Minimum | $2,499 | $22,500 |
| Maximum | $66,786 | $84,919 |
| Range | $64,287 | $62,419 |
| Mean | $43,106 | $52,531 |
| Median | $43,408 | $53,417 |
| Interquartile 25% (IQ1) | $38,221 | $42,247 |
| Interquartile 75% (IQ3) | $50,378 | $56,939 |
| Interquartile Range (IQR) | $12,158 | $14,692 |
| Standard Deviation (Sample) | $10,203 | $14,077 |
| Standard Deviation (Population) | $10,137 | $13,814 |
Demographics Similar to Croatians and South Africans by Median Earnings
In terms of median earnings, the demographic groups most similar to Croatians are Armenian ($49,804, a difference of 0.16%), Immigrants from Argentina ($49,841, a difference of 0.23%), Macedonian ($49,893, a difference of 0.34%), Italian ($49,915, a difference of 0.38%), and Immigrants from North America ($50,108, a difference of 0.77%). Similarly, the demographic groups most similar to South Africans are Immigrants from Scotland ($50,741, a difference of 0.020%), Immigrants from Italy ($50,581, a difference of 0.34%), Immigrants from Western Europe ($50,549, a difference of 0.40%), Argentinean ($50,399, a difference of 0.70%), and Laotian ($50,343, a difference of 0.81%).
| Demographics | Rating | Rank | Median Earnings |
| South Africans | 99.8 /100 | #74 | Exceptional $50,752 |
| Immigrants | Scotland | 99.8 /100 | #75 | Exceptional $50,741 |
| Immigrants | Italy | 99.7 /100 | #76 | Exceptional $50,581 |
| Immigrants | Western Europe | 99.7 /100 | #77 | Exceptional $50,549 |
| Argentineans | 99.6 /100 | #78 | Exceptional $50,399 |
| Laotians | 99.6 /100 | #79 | Exceptional $50,343 |
| Ukrainians | 99.6 /100 | #80 | Exceptional $50,320 |
| Immigrants | Southern Europe | 99.6 /100 | #81 | Exceptional $50,280 |
| Immigrants | Moldova | 99.5 /100 | #82 | Exceptional $50,274 |
| Romanians | 99.5 /100 | #83 | Exceptional $50,244 |
| Immigrants | Hungary | 99.5 /100 | #84 | Exceptional $50,227 |
| Immigrants | Kazakhstan | 99.5 /100 | #85 | Exceptional $50,225 |
| Immigrants | Canada | 99.5 /100 | #86 | Exceptional $50,192 |
| Immigrants | Uzbekistan | 99.5 /100 | #87 | Exceptional $50,151 |
| Albanians | 99.4 /100 | #88 | Exceptional $50,116 |
| Immigrants | North America | 99.4 /100 | #89 | Exceptional $50,108 |
| Italians | 99.3 /100 | #90 | Exceptional $49,915 |
| Macedonians | 99.2 /100 | #91 | Exceptional $49,893 |
| Immigrants | Argentina | 99.2 /100 | #92 | Exceptional $49,841 |
| Armenians | 99.1 /100 | #93 | Exceptional $49,804 |
| Croatians | 99.0 /100 | #94 | Exceptional $49,724 |