Creek vs Norwegian Householder Income Ages 25 - 44 years
COMPARE
Creek
Norwegian
Householder Income Ages 25 - 44 years
Householder Income Ages 25 - 44 years Comparison
Creek
Norwegians
$74,847
HOUSEHOLDER INCOME AGES 25 - 44 YEARS
0.0/ 100
METRIC RATING
334th/ 347
METRIC RANK
$96,866
HOUSEHOLDER INCOME AGES 25 - 44 YEARS
78.2/ 100
METRIC RATING
145th/ 347
METRIC RANK
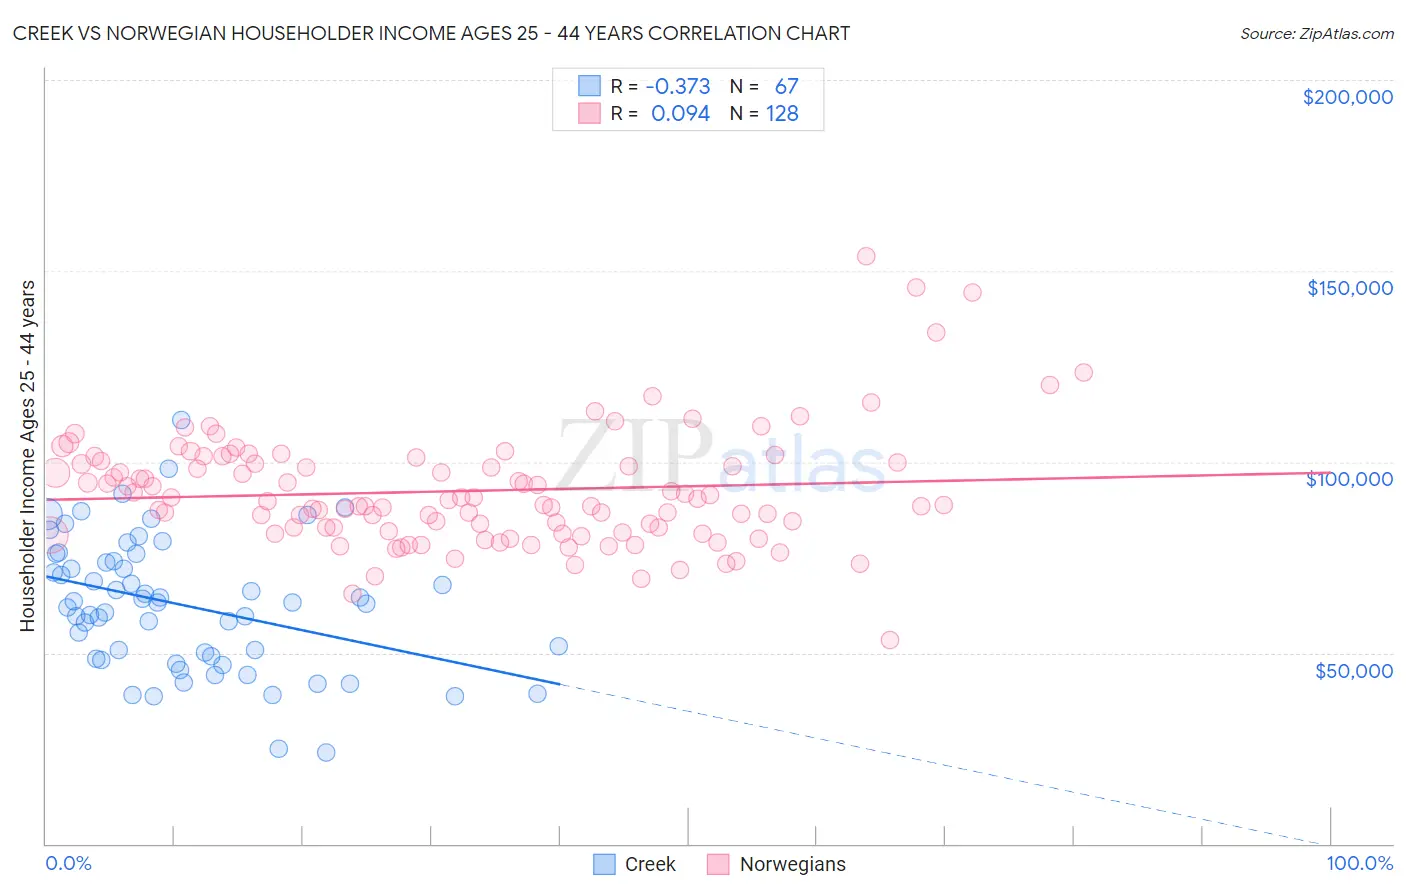
Creek vs Norwegian Householder Income Ages 25 - 44 years Correlation Chart
The statistical analysis conducted on geographies consisting of 178,137,913 people shows a mild negative correlation between the proportion of Creek and household income with householder between the ages 25 and 44 in the United States with a correlation coefficient (R) of -0.373 and weighted average of $74,847. Similarly, the statistical analysis conducted on geographies consisting of 529,618,426 people shows a slight positive correlation between the proportion of Norwegians and household income with householder between the ages 25 and 44 in the United States with a correlation coefficient (R) of 0.094 and weighted average of $96,866, a difference of 29.4%.
Householder Income Ages 25 - 44 years Correlation Summary
| Measurement | Creek | Norwegian |
| Minimum | $23,750 | $53,269 |
| Maximum | $110,938 | $153,750 |
| Range | $87,188 | $100,481 |
| Mean | $62,466 | $92,386 |
| Median | $63,125 | $89,798 |
| Interquartile 25% (IQ1) | $48,423 | $82,344 |
| Interquartile 75% (IQ3) | $74,039 | $100,008 |
| Interquartile Range (IQR) | $25,616 | $17,664 |
| Standard Deviation (Sample) | $17,416 | $15,216 |
| Standard Deviation (Population) | $17,285 | $15,156 |
Similar Demographics by Householder Income Ages 25 - 44 years
Demographics Similar to Creek by Householder Income Ages 25 - 44 years
In terms of householder income ages 25 - 44 years, the demographic groups most similar to Creek are Kiowa ($74,776, a difference of 0.10%), Hopi ($75,002, a difference of 0.21%), Bahamian ($75,395, a difference of 0.73%), Native/Alaskan ($75,647, a difference of 1.1%), and Yup'ik ($73,688, a difference of 1.6%).
| Demographics | Rating | Rank | Householder Income Ages 25 - 44 years |
| Immigrants | Bahamas | 0.0 /100 | #327 | Tragic $76,910 |
| Immigrants | Cuba | 0.0 /100 | #328 | Tragic $76,701 |
| Seminole | 0.0 /100 | #329 | Tragic $76,584 |
| Yakama | 0.0 /100 | #330 | Tragic $76,226 |
| Natives/Alaskans | 0.0 /100 | #331 | Tragic $75,647 |
| Bahamians | 0.0 /100 | #332 | Tragic $75,395 |
| Hopi | 0.0 /100 | #333 | Tragic $75,002 |
| Creek | 0.0 /100 | #334 | Tragic $74,847 |
| Kiowa | 0.0 /100 | #335 | Tragic $74,776 |
| Yup'ik | 0.0 /100 | #336 | Tragic $73,688 |
| Blacks/African Americans | 0.0 /100 | #337 | Tragic $73,370 |
| Immigrants | Yemen | 0.0 /100 | #338 | Tragic $73,043 |
| Yuman | 0.0 /100 | #339 | Tragic $72,956 |
| Immigrants | Congo | 0.0 /100 | #340 | Tragic $72,178 |
| Arapaho | 0.0 /100 | #341 | Tragic $71,697 |
Demographics Similar to Norwegians by Householder Income Ages 25 - 44 years
In terms of householder income ages 25 - 44 years, the demographic groups most similar to Norwegians are Ethiopian ($96,824, a difference of 0.040%), Immigrants from Syria ($96,789, a difference of 0.080%), Irish ($96,730, a difference of 0.14%), Basque ($96,709, a difference of 0.16%), and Ugandan ($96,667, a difference of 0.21%).
| Demographics | Rating | Rank | Householder Income Ages 25 - 44 years |
| Arabs | 82.3 /100 | #138 | Excellent $97,336 |
| Immigrants | Peru | 82.2 /100 | #139 | Excellent $97,329 |
| Immigrants | Morocco | 82.0 /100 | #140 | Excellent $97,305 |
| Luxembourgers | 81.5 /100 | #141 | Excellent $97,237 |
| Danes | 81.3 /100 | #142 | Excellent $97,221 |
| Immigrants | Jordan | 81.0 /100 | #143 | Excellent $97,185 |
| Immigrants | Chile | 80.8 /100 | #144 | Excellent $97,159 |
| Norwegians | 78.2 /100 | #145 | Good $96,866 |
| Ethiopians | 77.8 /100 | #146 | Good $96,824 |
| Immigrants | Syria | 77.4 /100 | #147 | Good $96,789 |
| Irish | 76.9 /100 | #148 | Good $96,730 |
| Basques | 76.6 /100 | #149 | Good $96,709 |
| Ugandans | 76.2 /100 | #150 | Good $96,667 |
| Czechs | 74.8 /100 | #151 | Good $96,525 |
| South American Indians | 74.5 /100 | #152 | Good $96,497 |