Creek vs Belgian Householder Income Ages 25 - 44 years
COMPARE
Creek
Belgian
Householder Income Ages 25 - 44 years
Householder Income Ages 25 - 44 years Comparison
Creek
Belgians
$74,847
HOUSEHOLDER INCOME AGES 25 - 44 YEARS
0.0/ 100
METRIC RATING
334th/ 347
METRIC RANK
$94,262
HOUSEHOLDER INCOME AGES 25 - 44 YEARS
45.8/ 100
METRIC RATING
177th/ 347
METRIC RANK
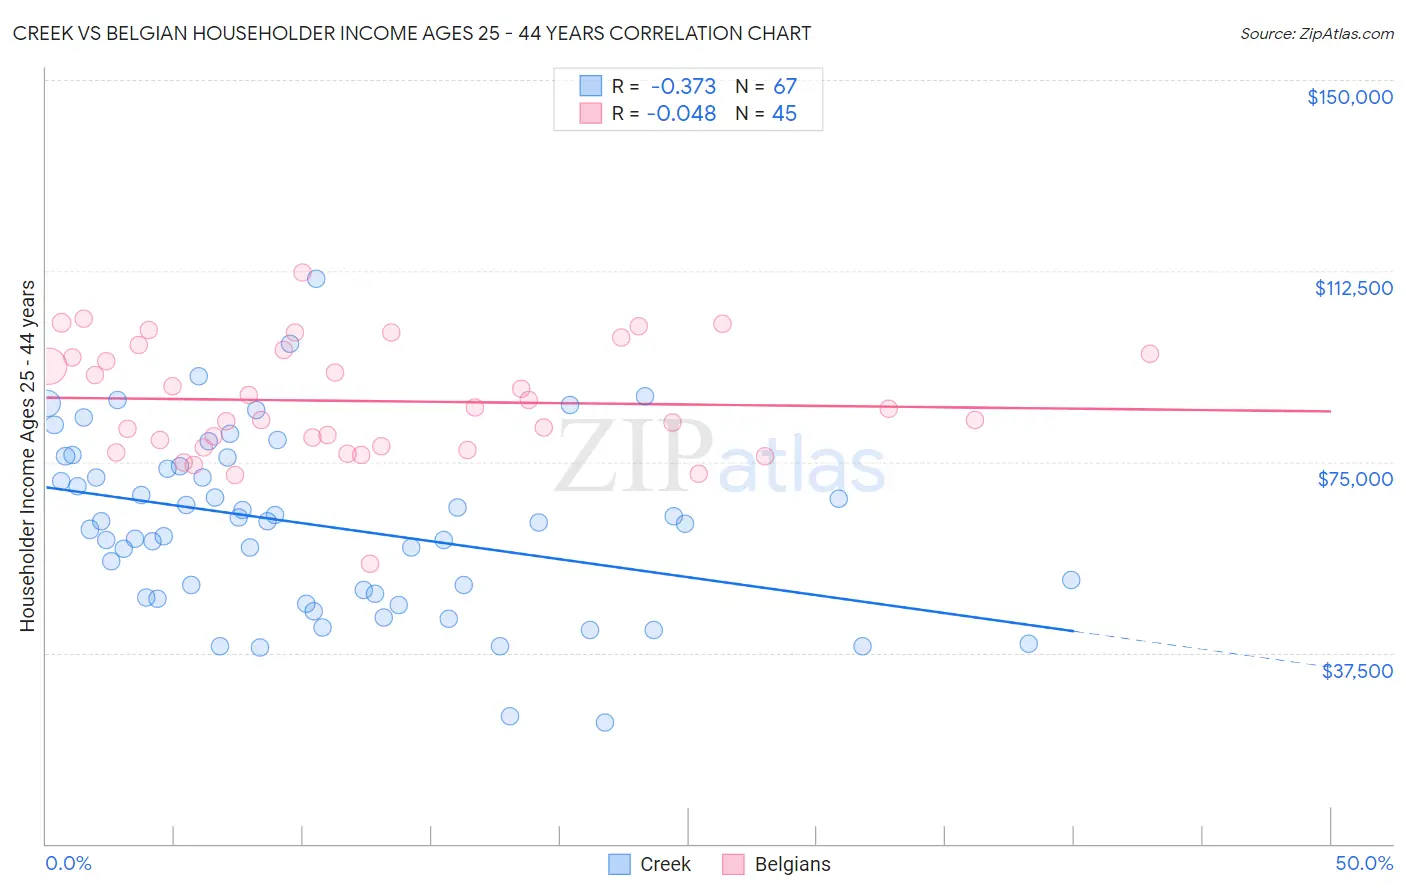
Creek vs Belgian Householder Income Ages 25 - 44 years Correlation Chart
The statistical analysis conducted on geographies consisting of 178,137,913 people shows a mild negative correlation between the proportion of Creek and household income with householder between the ages 25 and 44 in the United States with a correlation coefficient (R) of -0.373 and weighted average of $74,847. Similarly, the statistical analysis conducted on geographies consisting of 354,979,371 people shows no correlation between the proportion of Belgians and household income with householder between the ages 25 and 44 in the United States with a correlation coefficient (R) of -0.048 and weighted average of $94,262, a difference of 25.9%.
Householder Income Ages 25 - 44 years Correlation Summary
| Measurement | Creek | Belgian |
| Minimum | $23,750 | $55,000 |
| Maximum | $110,938 | $112,283 |
| Range | $87,188 | $57,283 |
| Mean | $62,466 | $86,931 |
| Median | $63,125 | $85,500 |
| Interquartile 25% (IQ1) | $48,423 | $78,009 |
| Interquartile 75% (IQ3) | $74,039 | $96,571 |
| Interquartile Range (IQR) | $25,616 | $18,562 |
| Standard Deviation (Sample) | $17,416 | $11,310 |
| Standard Deviation (Population) | $17,285 | $11,183 |
Similar Demographics by Householder Income Ages 25 - 44 years
Demographics Similar to Creek by Householder Income Ages 25 - 44 years
In terms of householder income ages 25 - 44 years, the demographic groups most similar to Creek are Kiowa ($74,776, a difference of 0.10%), Hopi ($75,002, a difference of 0.21%), Bahamian ($75,395, a difference of 0.73%), Native/Alaskan ($75,647, a difference of 1.1%), and Yup'ik ($73,688, a difference of 1.6%).
| Demographics | Rating | Rank | Householder Income Ages 25 - 44 years |
| Immigrants | Bahamas | 0.0 /100 | #327 | Tragic $76,910 |
| Immigrants | Cuba | 0.0 /100 | #328 | Tragic $76,701 |
| Seminole | 0.0 /100 | #329 | Tragic $76,584 |
| Yakama | 0.0 /100 | #330 | Tragic $76,226 |
| Natives/Alaskans | 0.0 /100 | #331 | Tragic $75,647 |
| Bahamians | 0.0 /100 | #332 | Tragic $75,395 |
| Hopi | 0.0 /100 | #333 | Tragic $75,002 |
| Creek | 0.0 /100 | #334 | Tragic $74,847 |
| Kiowa | 0.0 /100 | #335 | Tragic $74,776 |
| Yup'ik | 0.0 /100 | #336 | Tragic $73,688 |
| Blacks/African Americans | 0.0 /100 | #337 | Tragic $73,370 |
| Immigrants | Yemen | 0.0 /100 | #338 | Tragic $73,043 |
| Yuman | 0.0 /100 | #339 | Tragic $72,956 |
| Immigrants | Congo | 0.0 /100 | #340 | Tragic $72,178 |
| Arapaho | 0.0 /100 | #341 | Tragic $71,697 |
Demographics Similar to Belgians by Householder Income Ages 25 - 44 years
In terms of householder income ages 25 - 44 years, the demographic groups most similar to Belgians are Immigrants ($94,423, a difference of 0.17%), English ($94,429, a difference of 0.18%), Immigrants from South America ($94,042, a difference of 0.23%), Colombian ($94,565, a difference of 0.32%), and Finnish ($94,610, a difference of 0.37%).
| Demographics | Rating | Rank | Householder Income Ages 25 - 44 years |
| Slovaks | 56.4 /100 | #170 | Average $95,032 |
| Immigrants | Armenia | 54.2 /100 | #171 | Average $94,867 |
| Scottish | 50.8 /100 | #172 | Average $94,622 |
| Finns | 50.6 /100 | #173 | Average $94,610 |
| Colombians | 50.0 /100 | #174 | Average $94,565 |
| English | 48.1 /100 | #175 | Average $94,429 |
| Immigrants | Immigrants | 48.0 /100 | #176 | Average $94,423 |
| Belgians | 45.8 /100 | #177 | Average $94,262 |
| Immigrants | South America | 42.8 /100 | #178 | Average $94,042 |
| French Canadians | 38.2 /100 | #179 | Fair $93,694 |
| French | 37.8 /100 | #180 | Fair $93,665 |
| Puget Sound Salish | 37.7 /100 | #181 | Fair $93,661 |
| Uruguayans | 37.3 /100 | #182 | Fair $93,631 |
| Guamanians/Chamorros | 36.5 /100 | #183 | Fair $93,569 |
| Germans | 36.0 /100 | #184 | Fair $93,531 |