Immigrants from Haiti vs Norwegian Householder Income Ages 25 - 44 years
COMPARE
Immigrants from Haiti
Norwegian
Householder Income Ages 25 - 44 years
Householder Income Ages 25 - 44 years Comparison
Immigrants from Haiti
Norwegians
$79,391
HOUSEHOLDER INCOME AGES 25 - 44 YEARS
0.0/ 100
METRIC RATING
312th/ 347
METRIC RANK
$96,866
HOUSEHOLDER INCOME AGES 25 - 44 YEARS
78.2/ 100
METRIC RATING
145th/ 347
METRIC RANK
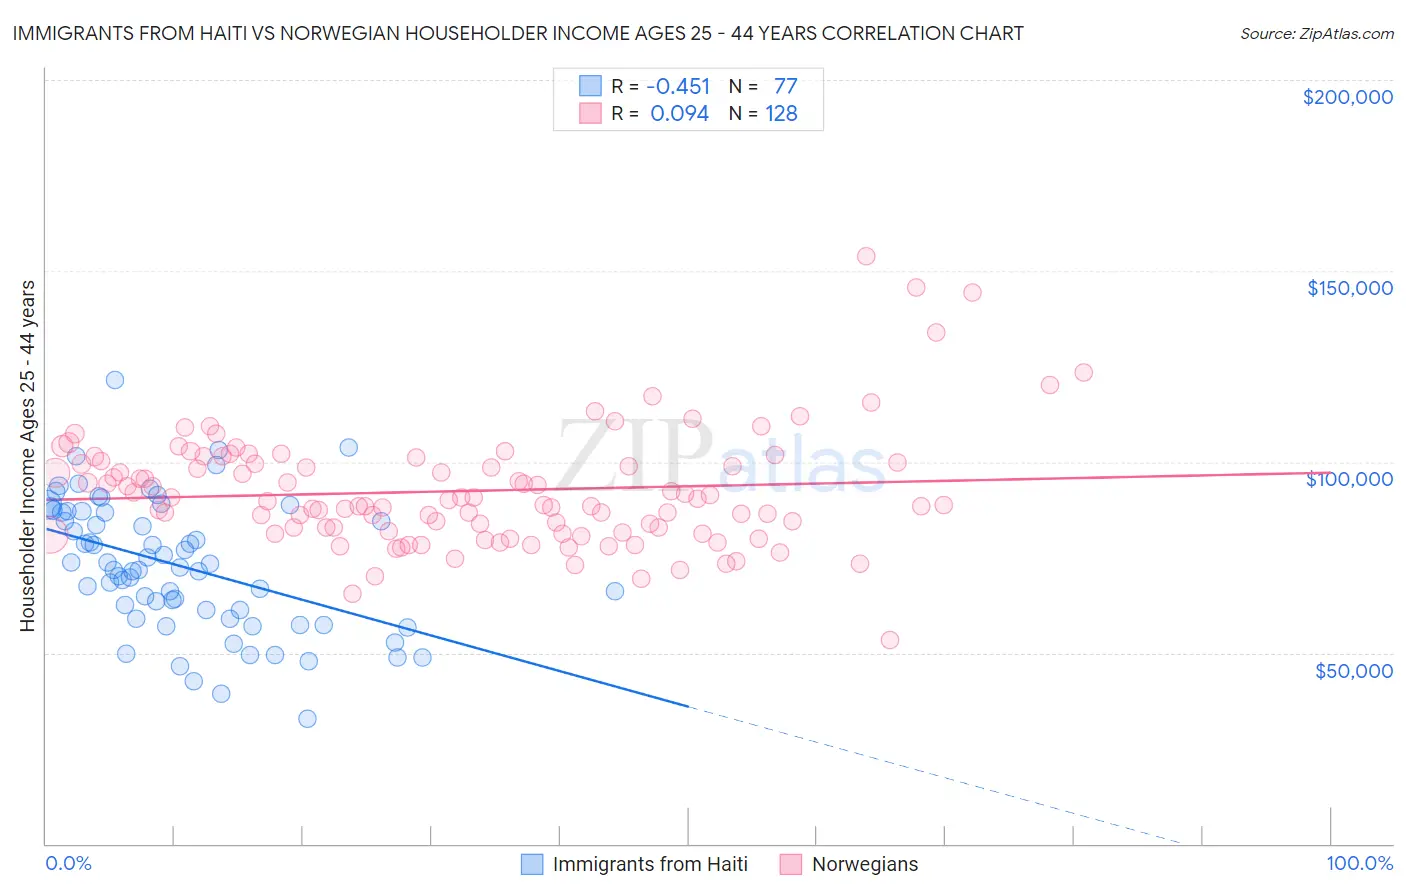
Immigrants from Haiti vs Norwegian Householder Income Ages 25 - 44 years Correlation Chart
The statistical analysis conducted on geographies consisting of 224,831,878 people shows a moderate negative correlation between the proportion of Immigrants from Haiti and household income with householder between the ages 25 and 44 in the United States with a correlation coefficient (R) of -0.451 and weighted average of $79,391. Similarly, the statistical analysis conducted on geographies consisting of 529,618,426 people shows a slight positive correlation between the proportion of Norwegians and household income with householder between the ages 25 and 44 in the United States with a correlation coefficient (R) of 0.094 and weighted average of $96,866, a difference of 22.0%.
Householder Income Ages 25 - 44 years Correlation Summary
| Measurement | Immigrants from Haiti | Norwegian |
| Minimum | $32,753 | $53,269 |
| Maximum | $121,599 | $153,750 |
| Range | $88,846 | $100,481 |
| Mean | $72,834 | $92,386 |
| Median | $72,419 | $89,798 |
| Interquartile 25% (IQ1) | $60,083 | $82,344 |
| Interquartile 75% (IQ3) | $86,997 | $100,008 |
| Interquartile Range (IQR) | $26,914 | $17,664 |
| Standard Deviation (Sample) | $17,154 | $15,216 |
| Standard Deviation (Population) | $17,042 | $15,156 |
Similar Demographics by Householder Income Ages 25 - 44 years
Demographics Similar to Immigrants from Haiti by Householder Income Ages 25 - 44 years
In terms of householder income ages 25 - 44 years, the demographic groups most similar to Immigrants from Haiti are Menominee ($79,358, a difference of 0.040%), Indonesian ($79,543, a difference of 0.19%), Cheyenne ($79,152, a difference of 0.30%), Ottawa ($79,012, a difference of 0.48%), and African ($78,986, a difference of 0.51%).
| Demographics | Rating | Rank | Householder Income Ages 25 - 44 years |
| Immigrants | Dominican Republic | 0.0 /100 | #305 | Tragic $80,319 |
| Apache | 0.0 /100 | #306 | Tragic $80,260 |
| Haitians | 0.0 /100 | #307 | Tragic $80,055 |
| Immigrants | Central America | 0.0 /100 | #308 | Tragic $80,012 |
| Chippewa | 0.0 /100 | #309 | Tragic $80,005 |
| Fijians | 0.0 /100 | #310 | Tragic $79,956 |
| Indonesians | 0.0 /100 | #311 | Tragic $79,543 |
| Immigrants | Haiti | 0.0 /100 | #312 | Tragic $79,391 |
| Menominee | 0.0 /100 | #313 | Tragic $79,358 |
| Cheyenne | 0.0 /100 | #314 | Tragic $79,152 |
| Ottawa | 0.0 /100 | #315 | Tragic $79,012 |
| Africans | 0.0 /100 | #316 | Tragic $78,986 |
| U.S. Virgin Islanders | 0.0 /100 | #317 | Tragic $78,911 |
| Immigrants | Mexico | 0.0 /100 | #318 | Tragic $78,809 |
| Hondurans | 0.0 /100 | #319 | Tragic $78,540 |
Demographics Similar to Norwegians by Householder Income Ages 25 - 44 years
In terms of householder income ages 25 - 44 years, the demographic groups most similar to Norwegians are Ethiopian ($96,824, a difference of 0.040%), Immigrants from Syria ($96,789, a difference of 0.080%), Irish ($96,730, a difference of 0.14%), Basque ($96,709, a difference of 0.16%), and Ugandan ($96,667, a difference of 0.21%).
| Demographics | Rating | Rank | Householder Income Ages 25 - 44 years |
| Arabs | 82.3 /100 | #138 | Excellent $97,336 |
| Immigrants | Peru | 82.2 /100 | #139 | Excellent $97,329 |
| Immigrants | Morocco | 82.0 /100 | #140 | Excellent $97,305 |
| Luxembourgers | 81.5 /100 | #141 | Excellent $97,237 |
| Danes | 81.3 /100 | #142 | Excellent $97,221 |
| Immigrants | Jordan | 81.0 /100 | #143 | Excellent $97,185 |
| Immigrants | Chile | 80.8 /100 | #144 | Excellent $97,159 |
| Norwegians | 78.2 /100 | #145 | Good $96,866 |
| Ethiopians | 77.8 /100 | #146 | Good $96,824 |
| Immigrants | Syria | 77.4 /100 | #147 | Good $96,789 |
| Irish | 76.9 /100 | #148 | Good $96,730 |
| Basques | 76.6 /100 | #149 | Good $96,709 |
| Ugandans | 76.2 /100 | #150 | Good $96,667 |
| Czechs | 74.8 /100 | #151 | Good $96,525 |
| South American Indians | 74.5 /100 | #152 | Good $96,497 |