Creek vs Norwegian 8th Grade
COMPARE
Creek
Norwegian
8th Grade
8th Grade Comparison
Creek
Norwegians
96.6%
8TH GRADE
99.7/ 100
METRIC RATING
68th/ 347
METRIC RANK
97.6%
8TH GRADE
100.0/ 100
METRIC RATING
7th/ 347
METRIC RANK
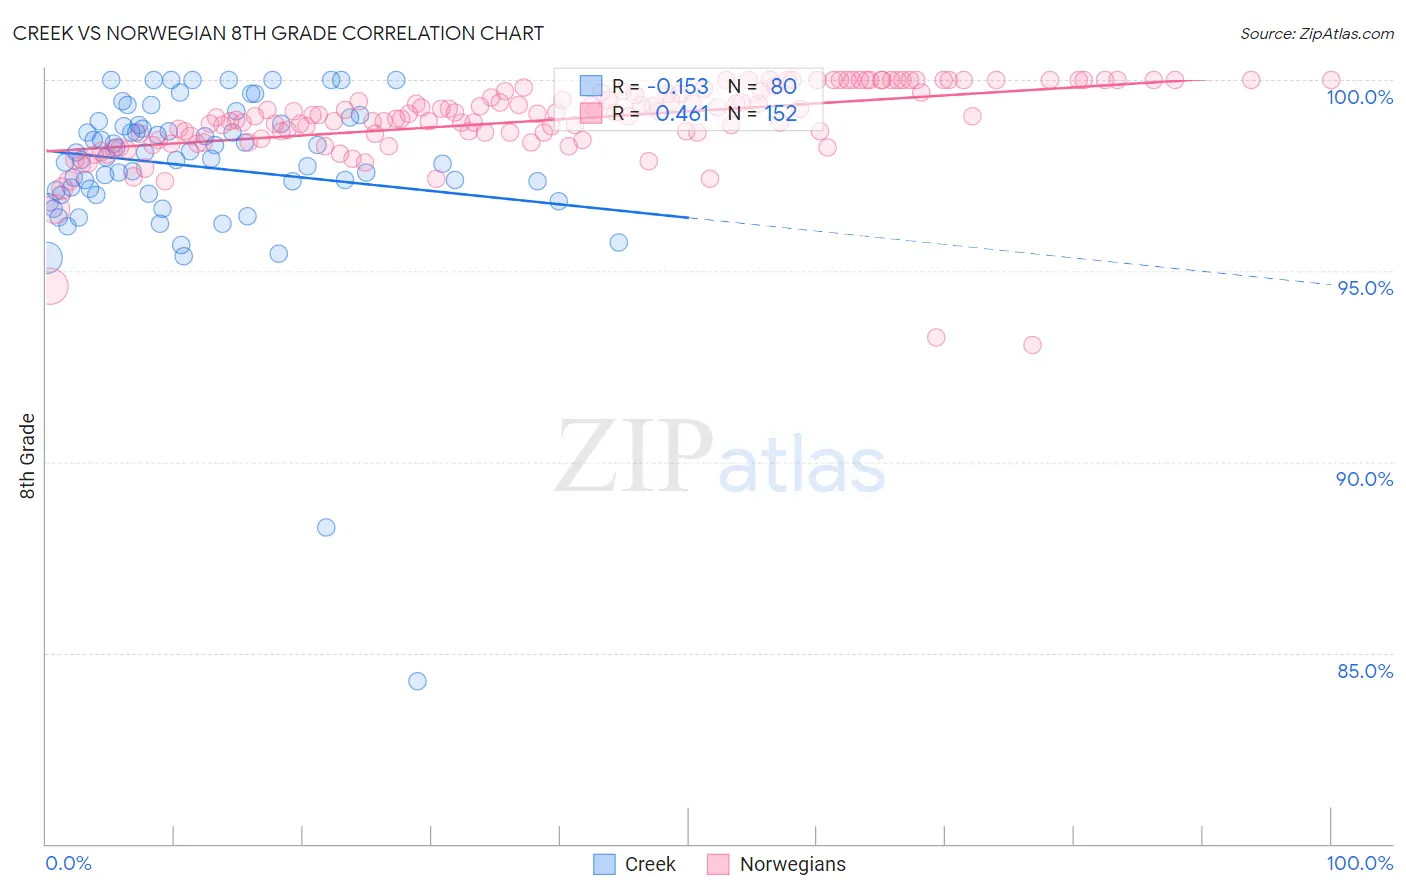
Creek vs Norwegian 8th Grade Correlation Chart
The statistical analysis conducted on geographies consisting of 178,480,629 people shows a poor negative correlation between the proportion of Creek and percentage of population with at least 8th grade education in the United States with a correlation coefficient (R) of -0.153 and weighted average of 96.6%. Similarly, the statistical analysis conducted on geographies consisting of 533,395,446 people shows a moderate positive correlation between the proportion of Norwegians and percentage of population with at least 8th grade education in the United States with a correlation coefficient (R) of 0.461 and weighted average of 97.6%, a difference of 1.0%.
8th Grade Correlation Summary
| Measurement | Creek | Norwegian |
| Minimum | 84.3% | 93.1% |
| Maximum | 100.0% | 100.0% |
| Range | 15.7% | 6.9% |
| Mean | 97.7% | 98.9% |
| Median | 98.0% | 99.1% |
| Interquartile 25% (IQ1) | 97.1% | 98.6% |
| Interquartile 75% (IQ3) | 98.8% | 99.7% |
| Interquartile Range (IQR) | 1.8% | 1.1% |
| Standard Deviation (Sample) | 2.3% | 1.1% |
| Standard Deviation (Population) | 2.2% | 1.1% |
Similar Demographics by 8th Grade
Demographics Similar to Creek by 8th Grade
In terms of 8th grade, the demographic groups most similar to Creek are American (96.6%, a difference of 0.0%), Iranian (96.6%, a difference of 0.010%), Immigrants from India (96.6%, a difference of 0.020%), Native Hawaiian (96.6%, a difference of 0.020%), and Canadian (96.6%, a difference of 0.020%).
| Demographics | Rating | Rank | 8th Grade |
| Immigrants | Austria | 99.8 /100 | #61 | Exceptional 96.7% |
| Whites/Caucasians | 99.8 /100 | #62 | Exceptional 96.7% |
| Ukrainians | 99.7 /100 | #63 | Exceptional 96.7% |
| Immigrants | India | 99.7 /100 | #64 | Exceptional 96.6% |
| Native Hawaiians | 99.7 /100 | #65 | Exceptional 96.6% |
| Canadians | 99.7 /100 | #66 | Exceptional 96.6% |
| Iranians | 99.7 /100 | #67 | Exceptional 96.6% |
| Creek | 99.7 /100 | #68 | Exceptional 96.6% |
| Americans | 99.7 /100 | #69 | Exceptional 96.6% |
| Immigrants | Lithuania | 99.6 /100 | #70 | Exceptional 96.6% |
| New Zealanders | 99.5 /100 | #71 | Exceptional 96.6% |
| Immigrants | England | 99.5 /100 | #72 | Exceptional 96.6% |
| Arapaho | 99.5 /100 | #73 | Exceptional 96.6% |
| Immigrants | Ireland | 99.5 /100 | #74 | Exceptional 96.5% |
| Zimbabweans | 99.4 /100 | #75 | Exceptional 96.5% |
Demographics Similar to Norwegians by 8th Grade
In terms of 8th grade, the demographic groups most similar to Norwegians are Slovak (97.6%, a difference of 0.040%), Dutch (97.7%, a difference of 0.060%), German (97.5%, a difference of 0.070%), Slovene (97.5%, a difference of 0.15%), and Polish (97.4%, a difference of 0.19%).
| Demographics | Rating | Rank | 8th Grade |
| Crow | 100.0 /100 | #1 | Exceptional 99.0% |
| Tsimshian | 100.0 /100 | #2 | Exceptional 99.0% |
| Finns | 100.0 /100 | #3 | Exceptional 98.4% |
| Carpatho Rusyns | 100.0 /100 | #4 | Exceptional 98.1% |
| Ottawa | 100.0 /100 | #5 | Exceptional 97.9% |
| Dutch | 100.0 /100 | #6 | Exceptional 97.7% |
| Norwegians | 100.0 /100 | #7 | Exceptional 97.6% |
| Slovaks | 100.0 /100 | #8 | Exceptional 97.6% |
| Germans | 100.0 /100 | #9 | Exceptional 97.5% |
| Slovenes | 100.0 /100 | #10 | Exceptional 97.5% |
| Poles | 100.0 /100 | #11 | Exceptional 97.4% |
| Swedes | 100.0 /100 | #12 | Exceptional 97.4% |
| Alaskan Athabascans | 100.0 /100 | #13 | Exceptional 97.3% |
| English | 100.0 /100 | #14 | Exceptional 97.3% |
| Pennsylvania Germans | 100.0 /100 | #15 | Exceptional 97.3% |