Creek vs Immigrants from Ecuador Householder Income Ages 25 - 44 years
COMPARE
Creek
Immigrants from Ecuador
Householder Income Ages 25 - 44 years
Householder Income Ages 25 - 44 years Comparison
Creek
Immigrants from Ecuador
$74,847
HOUSEHOLDER INCOME AGES 25 - 44 YEARS
0.0/ 100
METRIC RATING
334th/ 347
METRIC RANK
$89,673
HOUSEHOLDER INCOME AGES 25 - 44 YEARS
6.2/ 100
METRIC RATING
222nd/ 347
METRIC RANK
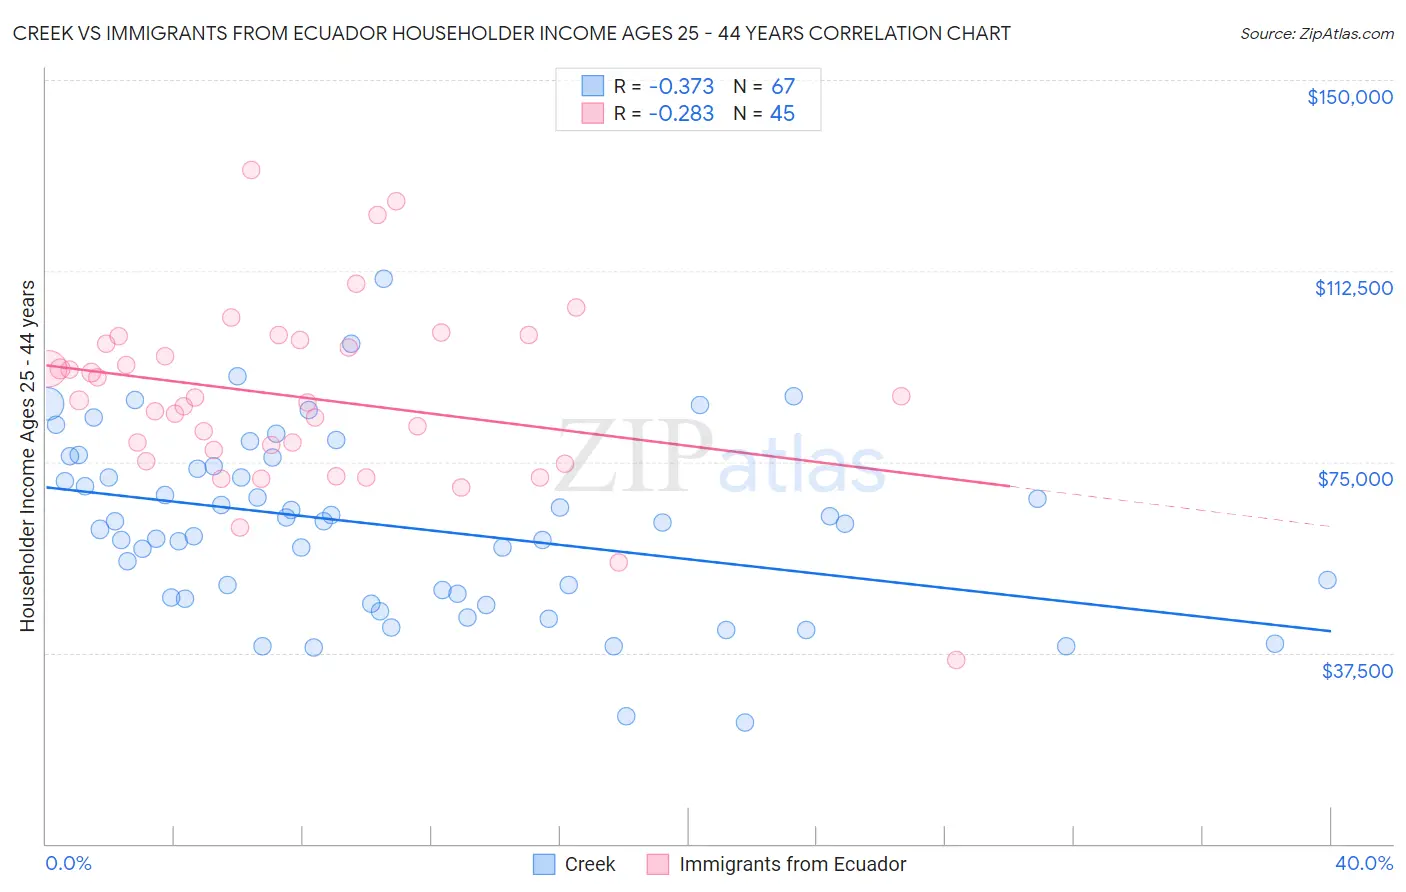
Creek vs Immigrants from Ecuador Householder Income Ages 25 - 44 years Correlation Chart
The statistical analysis conducted on geographies consisting of 178,137,913 people shows a mild negative correlation between the proportion of Creek and household income with householder between the ages 25 and 44 in the United States with a correlation coefficient (R) of -0.373 and weighted average of $74,847. Similarly, the statistical analysis conducted on geographies consisting of 270,658,714 people shows a weak negative correlation between the proportion of Immigrants from Ecuador and household income with householder between the ages 25 and 44 in the United States with a correlation coefficient (R) of -0.283 and weighted average of $89,673, a difference of 19.8%.
Householder Income Ages 25 - 44 years Correlation Summary
| Measurement | Creek | Immigrants from Ecuador |
| Minimum | $23,750 | $36,176 |
| Maximum | $110,938 | $132,426 |
| Range | $87,188 | $96,250 |
| Mean | $62,466 | $87,697 |
| Median | $63,125 | $87,101 |
| Interquartile 25% (IQ1) | $48,423 | $76,225 |
| Interquartile 75% (IQ3) | $74,039 | $98,630 |
| Interquartile Range (IQR) | $25,616 | $22,405 |
| Standard Deviation (Sample) | $17,416 | $17,650 |
| Standard Deviation (Population) | $17,285 | $17,453 |
Similar Demographics by Householder Income Ages 25 - 44 years
Demographics Similar to Creek by Householder Income Ages 25 - 44 years
In terms of householder income ages 25 - 44 years, the demographic groups most similar to Creek are Kiowa ($74,776, a difference of 0.10%), Hopi ($75,002, a difference of 0.21%), Bahamian ($75,395, a difference of 0.73%), Native/Alaskan ($75,647, a difference of 1.1%), and Yup'ik ($73,688, a difference of 1.6%).
| Demographics | Rating | Rank | Householder Income Ages 25 - 44 years |
| Immigrants | Bahamas | 0.0 /100 | #327 | Tragic $76,910 |
| Immigrants | Cuba | 0.0 /100 | #328 | Tragic $76,701 |
| Seminole | 0.0 /100 | #329 | Tragic $76,584 |
| Yakama | 0.0 /100 | #330 | Tragic $76,226 |
| Natives/Alaskans | 0.0 /100 | #331 | Tragic $75,647 |
| Bahamians | 0.0 /100 | #332 | Tragic $75,395 |
| Hopi | 0.0 /100 | #333 | Tragic $75,002 |
| Creek | 0.0 /100 | #334 | Tragic $74,847 |
| Kiowa | 0.0 /100 | #335 | Tragic $74,776 |
| Yup'ik | 0.0 /100 | #336 | Tragic $73,688 |
| Blacks/African Americans | 0.0 /100 | #337 | Tragic $73,370 |
| Immigrants | Yemen | 0.0 /100 | #338 | Tragic $73,043 |
| Yuman | 0.0 /100 | #339 | Tragic $72,956 |
| Immigrants | Congo | 0.0 /100 | #340 | Tragic $72,178 |
| Arapaho | 0.0 /100 | #341 | Tragic $71,697 |
Demographics Similar to Immigrants from Ecuador by Householder Income Ages 25 - 44 years
In terms of householder income ages 25 - 44 years, the demographic groups most similar to Immigrants from Ecuador are Immigrants from Trinidad and Tobago ($89,748, a difference of 0.080%), Immigrants from Guyana ($89,586, a difference of 0.10%), Barbadian ($89,565, a difference of 0.12%), Trinidadian and Tobagonian ($89,856, a difference of 0.20%), and Delaware ($89,876, a difference of 0.23%).
| Demographics | Rating | Rank | Householder Income Ages 25 - 44 years |
| Panamanians | 8.1 /100 | #215 | Tragic $90,193 |
| Ghanaians | 7.9 /100 | #216 | Tragic $90,137 |
| Scotch-Irish | 7.3 /100 | #217 | Tragic $89,969 |
| Guyanese | 7.1 /100 | #218 | Tragic $89,940 |
| Delaware | 6.9 /100 | #219 | Tragic $89,876 |
| Trinidadians and Tobagonians | 6.8 /100 | #220 | Tragic $89,856 |
| Immigrants | Trinidad and Tobago | 6.5 /100 | #221 | Tragic $89,748 |
| Immigrants | Ecuador | 6.2 /100 | #222 | Tragic $89,673 |
| Immigrants | Guyana | 5.9 /100 | #223 | Tragic $89,586 |
| Barbadians | 5.9 /100 | #224 | Tragic $89,565 |
| Immigrants | Panama | 5.5 /100 | #225 | Tragic $89,451 |
| Immigrants | Iraq | 5.5 /100 | #226 | Tragic $89,444 |
| Immigrants | St. Vincent and the Grenadines | 4.1 /100 | #227 | Tragic $88,888 |
| Immigrants | Bosnia and Herzegovina | 4.0 /100 | #228 | Tragic $88,819 |
| Immigrants | Barbados | 3.7 /100 | #229 | Tragic $88,687 |