Immigrants from Asia vs Norwegian Householder Income Ages 25 - 44 years
COMPARE
Immigrants from Asia
Norwegian
Householder Income Ages 25 - 44 years
Householder Income Ages 25 - 44 years Comparison
Immigrants from Asia
Norwegians
$110,787
HOUSEHOLDER INCOME AGES 25 - 44 YEARS
100.0/ 100
METRIC RATING
26th/ 347
METRIC RANK
$96,866
HOUSEHOLDER INCOME AGES 25 - 44 YEARS
78.2/ 100
METRIC RATING
145th/ 347
METRIC RANK
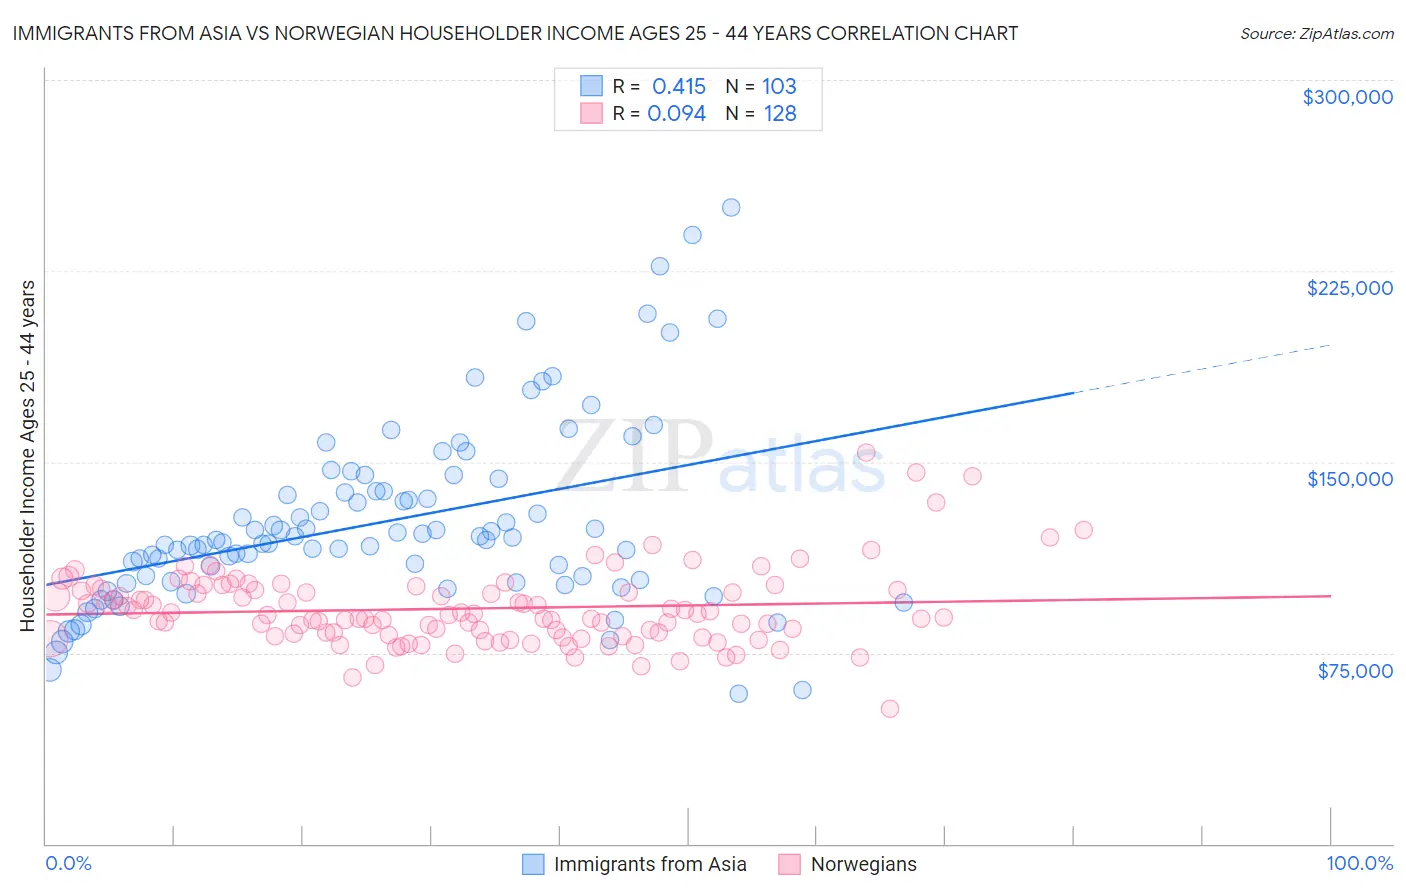
Immigrants from Asia vs Norwegian Householder Income Ages 25 - 44 years Correlation Chart
The statistical analysis conducted on geographies consisting of 545,439,082 people shows a moderate positive correlation between the proportion of Immigrants from Asia and household income with householder between the ages 25 and 44 in the United States with a correlation coefficient (R) of 0.415 and weighted average of $110,787. Similarly, the statistical analysis conducted on geographies consisting of 529,618,426 people shows a slight positive correlation between the proportion of Norwegians and household income with householder between the ages 25 and 44 in the United States with a correlation coefficient (R) of 0.094 and weighted average of $96,866, a difference of 14.4%.
Householder Income Ages 25 - 44 years Correlation Summary
| Measurement | Immigrants from Asia | Norwegian |
| Minimum | $58,833 | $53,269 |
| Maximum | $250,001 | $153,750 |
| Range | $191,168 | $100,481 |
| Mean | $126,497 | $92,386 |
| Median | $119,126 | $89,798 |
| Interquartile 25% (IQ1) | $102,983 | $82,344 |
| Interquartile 75% (IQ3) | $138,372 | $100,008 |
| Interquartile Range (IQR) | $35,389 | $17,664 |
| Standard Deviation (Sample) | $36,204 | $15,216 |
| Standard Deviation (Population) | $36,028 | $15,156 |
Similar Demographics by Householder Income Ages 25 - 44 years
Demographics Similar to Immigrants from Asia by Householder Income Ages 25 - 44 years
In terms of householder income ages 25 - 44 years, the demographic groups most similar to Immigrants from Asia are Russian ($110,398, a difference of 0.35%), Immigrants from Denmark ($110,363, a difference of 0.38%), Turkish ($110,318, a difference of 0.42%), Immigrants from Greece ($110,103, a difference of 0.62%), and Maltese ($110,064, a difference of 0.66%).
| Demographics | Rating | Rank | Householder Income Ages 25 - 44 years |
| Burmese | 100.0 /100 | #19 | Exceptional $113,701 |
| Immigrants | Korea | 100.0 /100 | #20 | Exceptional $113,401 |
| Asians | 100.0 /100 | #21 | Exceptional $112,666 |
| Immigrants | Belgium | 100.0 /100 | #22 | Exceptional $112,575 |
| Immigrants | Japan | 100.0 /100 | #23 | Exceptional $112,228 |
| Immigrants | Sweden | 100.0 /100 | #24 | Exceptional $112,010 |
| Immigrants | Northern Europe | 100.0 /100 | #25 | Exceptional $111,676 |
| Immigrants | Asia | 100.0 /100 | #26 | Exceptional $110,787 |
| Russians | 100.0 /100 | #27 | Exceptional $110,398 |
| Immigrants | Denmark | 100.0 /100 | #28 | Exceptional $110,363 |
| Turks | 100.0 /100 | #29 | Exceptional $110,318 |
| Immigrants | Greece | 100.0 /100 | #30 | Exceptional $110,103 |
| Maltese | 100.0 /100 | #31 | Exceptional $110,064 |
| Immigrants | Sri Lanka | 100.0 /100 | #32 | Exceptional $109,741 |
| Bhutanese | 100.0 /100 | #33 | Exceptional $109,520 |
Demographics Similar to Norwegians by Householder Income Ages 25 - 44 years
In terms of householder income ages 25 - 44 years, the demographic groups most similar to Norwegians are Ethiopian ($96,824, a difference of 0.040%), Immigrants from Syria ($96,789, a difference of 0.080%), Irish ($96,730, a difference of 0.14%), Basque ($96,709, a difference of 0.16%), and Ugandan ($96,667, a difference of 0.21%).
| Demographics | Rating | Rank | Householder Income Ages 25 - 44 years |
| Arabs | 82.3 /100 | #138 | Excellent $97,336 |
| Immigrants | Peru | 82.2 /100 | #139 | Excellent $97,329 |
| Immigrants | Morocco | 82.0 /100 | #140 | Excellent $97,305 |
| Luxembourgers | 81.5 /100 | #141 | Excellent $97,237 |
| Danes | 81.3 /100 | #142 | Excellent $97,221 |
| Immigrants | Jordan | 81.0 /100 | #143 | Excellent $97,185 |
| Immigrants | Chile | 80.8 /100 | #144 | Excellent $97,159 |
| Norwegians | 78.2 /100 | #145 | Good $96,866 |
| Ethiopians | 77.8 /100 | #146 | Good $96,824 |
| Immigrants | Syria | 77.4 /100 | #147 | Good $96,789 |
| Irish | 76.9 /100 | #148 | Good $96,730 |
| Basques | 76.6 /100 | #149 | Good $96,709 |
| Ugandans | 76.2 /100 | #150 | Good $96,667 |
| Czechs | 74.8 /100 | #151 | Good $96,525 |
| South American Indians | 74.5 /100 | #152 | Good $96,497 |