Creek vs Chilean Median Male Earnings
COMPARE
Creek
Chilean
Median Male Earnings
Median Male Earnings Comparison
Creek
Chileans
$46,594
MEDIAN MALE EARNINGS
0.0/ 100
METRIC RATING
309th/ 347
METRIC RANK
$56,973
MEDIAN MALE EARNINGS
91.9/ 100
METRIC RATING
124th/ 347
METRIC RANK
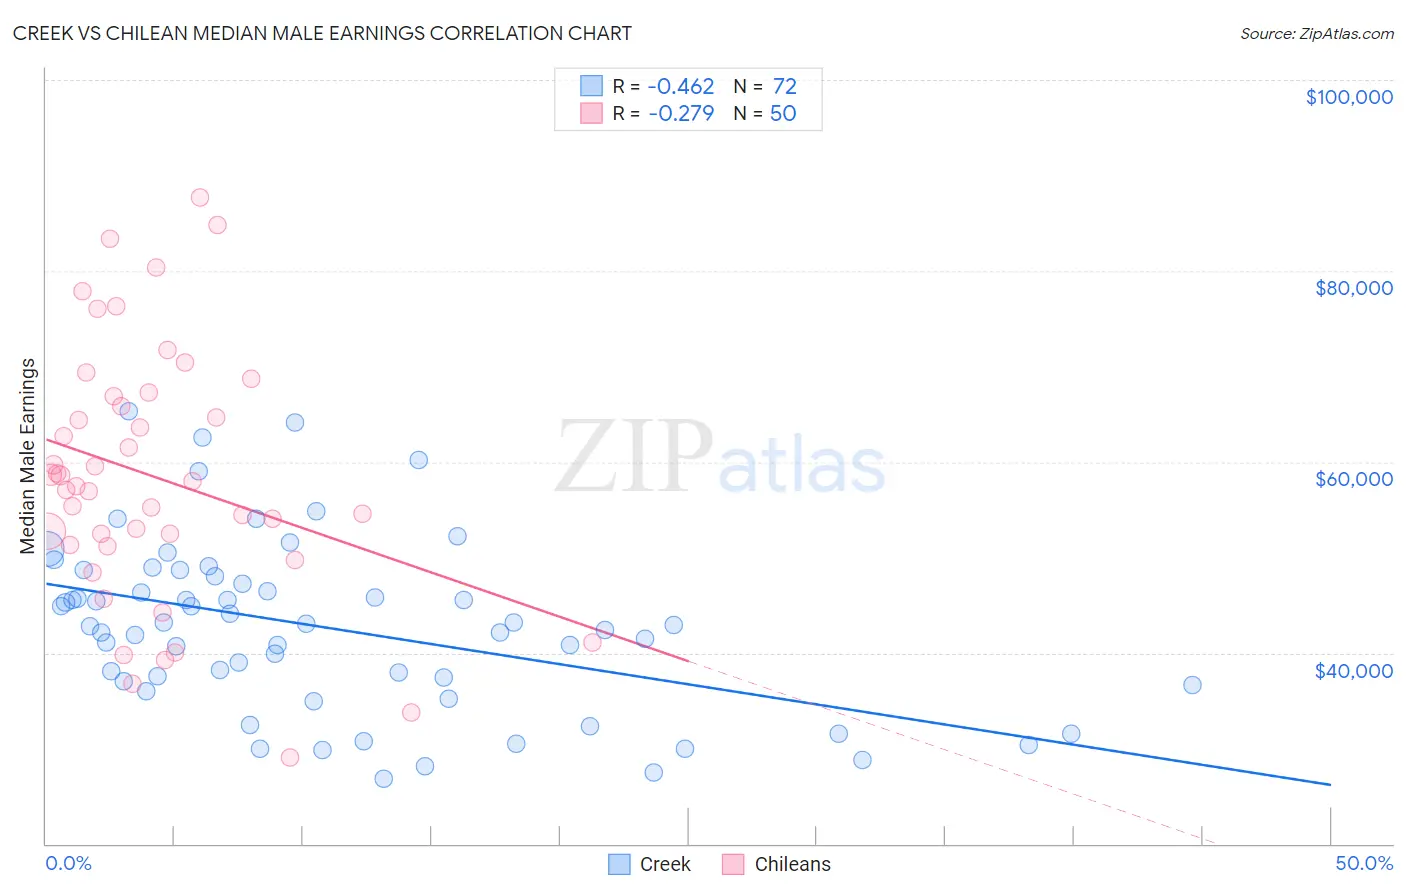
Creek vs Chilean Median Male Earnings Correlation Chart
The statistical analysis conducted on geographies consisting of 178,430,593 people shows a moderate negative correlation between the proportion of Creek and median male earnings in the United States with a correlation coefficient (R) of -0.462 and weighted average of $46,594. Similarly, the statistical analysis conducted on geographies consisting of 256,627,100 people shows a weak negative correlation between the proportion of Chileans and median male earnings in the United States with a correlation coefficient (R) of -0.279 and weighted average of $56,973, a difference of 22.3%.
Median Male Earnings Correlation Summary
| Measurement | Creek | Chilean |
| Minimum | $26,855 | $29,032 |
| Maximum | $65,299 | $87,679 |
| Range | $38,444 | $58,647 |
| Mean | $42,595 | $58,454 |
| Median | $42,837 | $57,750 |
| Interquartile 25% (IQ1) | $36,835 | $51,349 |
| Interquartile 75% (IQ3) | $47,588 | $66,830 |
| Interquartile Range (IQR) | $10,753 | $15,482 |
| Standard Deviation (Sample) | $8,932 | $13,319 |
| Standard Deviation (Population) | $8,870 | $13,185 |
Similar Demographics by Median Male Earnings
Demographics Similar to Creek by Median Male Earnings
In terms of median male earnings, the demographic groups most similar to Creek are Cuban ($46,580, a difference of 0.030%), Ottawa ($46,611, a difference of 0.040%), Dutch West Indian ($46,656, a difference of 0.13%), Immigrants from Dominican Republic ($46,655, a difference of 0.13%), and Guatemalan ($46,736, a difference of 0.30%).
| Demographics | Rating | Rank | Median Male Earnings |
| Seminole | 0.1 /100 | #302 | Tragic $46,783 |
| Yaqui | 0.1 /100 | #303 | Tragic $46,777 |
| Bangladeshis | 0.1 /100 | #304 | Tragic $46,744 |
| Guatemalans | 0.0 /100 | #305 | Tragic $46,736 |
| Dutch West Indians | 0.0 /100 | #306 | Tragic $46,656 |
| Immigrants | Dominican Republic | 0.0 /100 | #307 | Tragic $46,655 |
| Ottawa | 0.0 /100 | #308 | Tragic $46,611 |
| Creek | 0.0 /100 | #309 | Tragic $46,594 |
| Cubans | 0.0 /100 | #310 | Tragic $46,580 |
| Apache | 0.0 /100 | #311 | Tragic $46,429 |
| Hispanics or Latinos | 0.0 /100 | #312 | Tragic $46,419 |
| Hondurans | 0.0 /100 | #313 | Tragic $46,374 |
| Chippewa | 0.0 /100 | #314 | Tragic $46,368 |
| Immigrants | Guatemala | 0.0 /100 | #315 | Tragic $46,244 |
| Immigrants | Caribbean | 0.0 /100 | #316 | Tragic $46,193 |
Demographics Similar to Chileans by Median Male Earnings
In terms of median male earnings, the demographic groups most similar to Chileans are Immigrants from Morocco ($56,958, a difference of 0.030%), Chinese ($56,872, a difference of 0.18%), Brazilian ($56,837, a difference of 0.24%), Immigrants from Syria ($56,830, a difference of 0.25%), and Immigrants from Jordan ($57,145, a difference of 0.30%).
| Demographics | Rating | Rank | Median Male Earnings |
| Immigrants | Zimbabwe | 94.3 /100 | #117 | Exceptional $57,352 |
| Hungarians | 94.0 /100 | #118 | Exceptional $57,309 |
| Arabs | 94.0 /100 | #119 | Exceptional $57,298 |
| Canadians | 93.9 /100 | #120 | Exceptional $57,286 |
| Immigrants | Albania | 93.3 /100 | #121 | Exceptional $57,179 |
| Immigrants | Jordan | 93.1 /100 | #122 | Exceptional $57,145 |
| Slovenes | 93.1 /100 | #123 | Exceptional $57,145 |
| Chileans | 91.9 /100 | #124 | Exceptional $56,973 |
| Immigrants | Morocco | 91.8 /100 | #125 | Exceptional $56,958 |
| Chinese | 91.1 /100 | #126 | Exceptional $56,872 |
| Brazilians | 90.9 /100 | #127 | Exceptional $56,837 |
| Immigrants | Syria | 90.8 /100 | #128 | Exceptional $56,830 |
| Pakistanis | 89.9 /100 | #129 | Excellent $56,719 |
| Koreans | 89.4 /100 | #130 | Excellent $56,672 |
| Portuguese | 89.4 /100 | #131 | Excellent $56,663 |