Cree vs Indian (Asian) Median Male Earnings
COMPARE
Cree
Indian (Asian)
Median Male Earnings
Median Male Earnings Comparison
Cree
Indians (Asian)
$49,497
MEDIAN MALE EARNINGS
0.7/ 100
METRIC RATING
258th/ 347
METRIC RANK
$66,078
MEDIAN MALE EARNINGS
100.0/ 100
METRIC RATING
18th/ 347
METRIC RANK
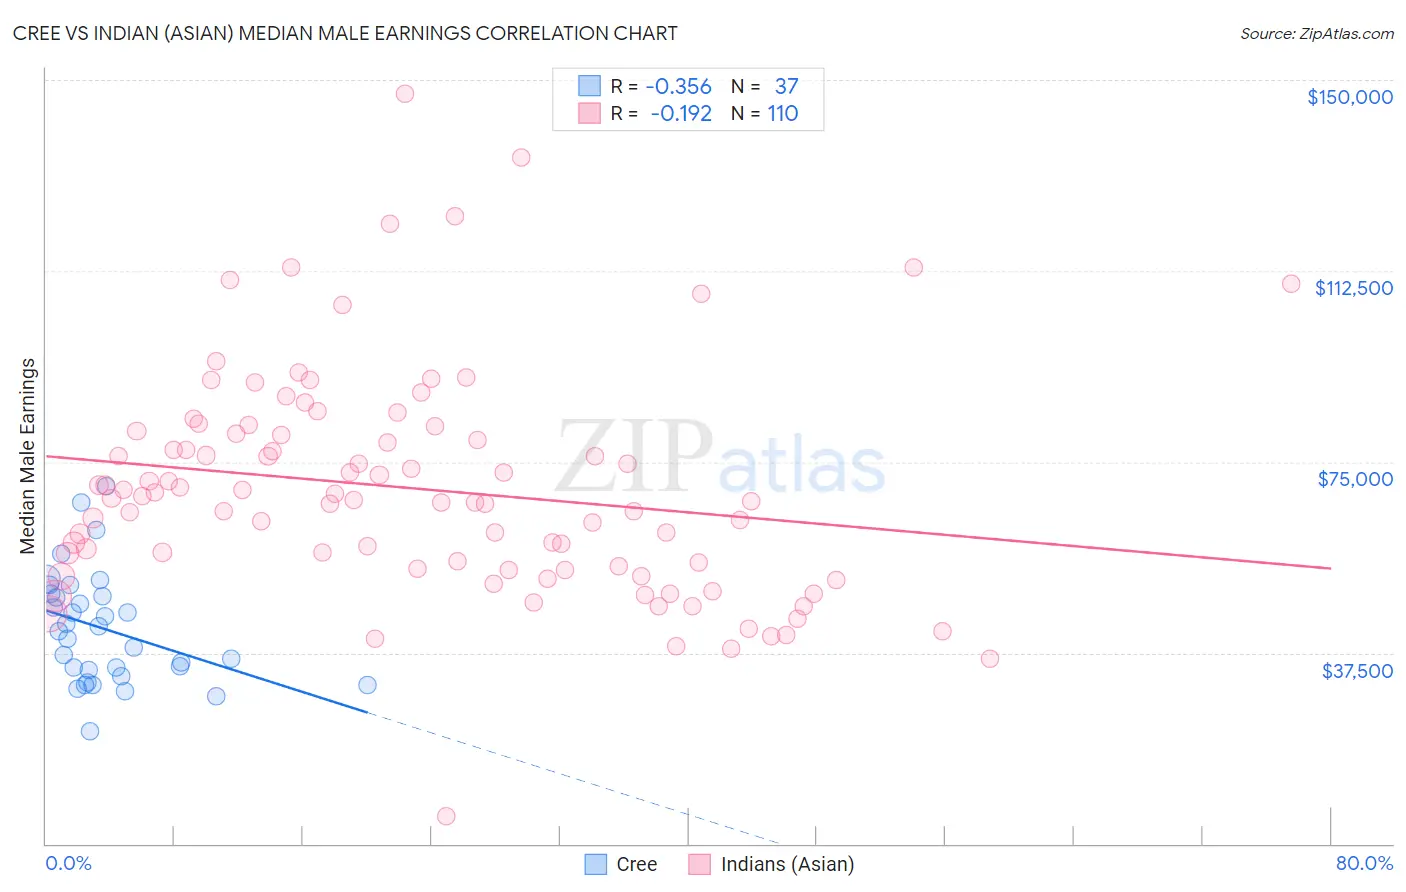
Cree vs Indian (Asian) Median Male Earnings Correlation Chart
The statistical analysis conducted on geographies consisting of 76,198,776 people shows a mild negative correlation between the proportion of Cree and median male earnings in the United States with a correlation coefficient (R) of -0.356 and weighted average of $49,497. Similarly, the statistical analysis conducted on geographies consisting of 494,843,397 people shows a poor negative correlation between the proportion of Indians (Asian) and median male earnings in the United States with a correlation coefficient (R) of -0.192 and weighted average of $66,078, a difference of 33.5%.
Median Male Earnings Correlation Summary
| Measurement | Cree | Indian (Asian) |
| Minimum | $22,163 | $5,439 |
| Maximum | $70,294 | $147,267 |
| Range | $48,131 | $141,828 |
| Mean | $42,158 | $69,730 |
| Median | $41,730 | $67,689 |
| Interquartile 25% (IQ1) | $33,580 | $53,972 |
| Interquartile 75% (IQ3) | $48,892 | $80,584 |
| Interquartile Range (IQR) | $15,312 | $26,612 |
| Standard Deviation (Sample) | $10,951 | $22,146 |
| Standard Deviation (Population) | $10,802 | $22,045 |
Similar Demographics by Median Male Earnings
Demographics Similar to Cree by Median Male Earnings
In terms of median male earnings, the demographic groups most similar to Cree are Nepalese ($49,458, a difference of 0.080%), Iroquois ($49,374, a difference of 0.25%), British West Indian ($49,636, a difference of 0.28%), Liberian ($49,318, a difference of 0.36%), and Alaska Native ($49,711, a difference of 0.43%).
| Demographics | Rating | Rank | Median Male Earnings |
| Immigrants | Grenada | 1.6 /100 | #251 | Tragic $50,279 |
| Immigrants | Cabo Verde | 1.2 /100 | #252 | Tragic $50,009 |
| German Russians | 1.1 /100 | #253 | Tragic $49,924 |
| Senegalese | 1.0 /100 | #254 | Tragic $49,774 |
| Alaskan Athabascans | 0.9 /100 | #255 | Tragic $49,748 |
| Alaska Natives | 0.9 /100 | #256 | Tragic $49,711 |
| British West Indians | 0.8 /100 | #257 | Tragic $49,636 |
| Cree | 0.7 /100 | #258 | Tragic $49,497 |
| Nepalese | 0.7 /100 | #259 | Tragic $49,458 |
| Iroquois | 0.7 /100 | #260 | Tragic $49,374 |
| Liberians | 0.6 /100 | #261 | Tragic $49,318 |
| Immigrants | West Indies | 0.6 /100 | #262 | Tragic $49,271 |
| Nicaraguans | 0.6 /100 | #263 | Tragic $49,215 |
| Immigrants | Middle Africa | 0.6 /100 | #264 | Tragic $49,201 |
| Immigrants | Laos | 0.6 /100 | #265 | Tragic $49,190 |
Demographics Similar to Indians (Asian) by Median Male Earnings
In terms of median male earnings, the demographic groups most similar to Indians (Asian) are Immigrants from Belgium ($66,125, a difference of 0.070%), Eastern European ($66,472, a difference of 0.60%), Cypriot ($65,549, a difference of 0.81%), Immigrants from Japan ($65,518, a difference of 0.85%), and Immigrants from Sweden ($65,406, a difference of 1.0%).
| Demographics | Rating | Rank | Median Male Earnings |
| Immigrants | Ireland | 100.0 /100 | #11 | Exceptional $67,698 |
| Immigrants | Australia | 100.0 /100 | #12 | Exceptional $67,634 |
| Immigrants | China | 100.0 /100 | #13 | Exceptional $67,353 |
| Okinawans | 100.0 /100 | #14 | Exceptional $67,232 |
| Immigrants | Eastern Asia | 100.0 /100 | #15 | Exceptional $66,903 |
| Eastern Europeans | 100.0 /100 | #16 | Exceptional $66,472 |
| Immigrants | Belgium | 100.0 /100 | #17 | Exceptional $66,125 |
| Indians (Asian) | 100.0 /100 | #18 | Exceptional $66,078 |
| Cypriots | 100.0 /100 | #19 | Exceptional $65,549 |
| Immigrants | Japan | 100.0 /100 | #20 | Exceptional $65,518 |
| Immigrants | Sweden | 100.0 /100 | #21 | Exceptional $65,406 |
| Burmese | 100.0 /100 | #22 | Exceptional $65,236 |
| Immigrants | Korea | 100.0 /100 | #23 | Exceptional $65,079 |
| Immigrants | Northern Europe | 100.0 /100 | #24 | Exceptional $64,987 |
| Immigrants | Denmark | 100.0 /100 | #25 | Exceptional $64,625 |