Immigrants from South America vs Ugandan Median Male Earnings
COMPARE
Immigrants from South America
Ugandan
Median Male Earnings
Median Male Earnings Comparison
Immigrants from South America
Ugandans
$53,962
MEDIAN MALE EARNINGS
37.3/ 100
METRIC RATING
183rd/ 347
METRIC RANK
$55,290
MEDIAN MALE EARNINGS
68.6/ 100
METRIC RATING
163rd/ 347
METRIC RANK
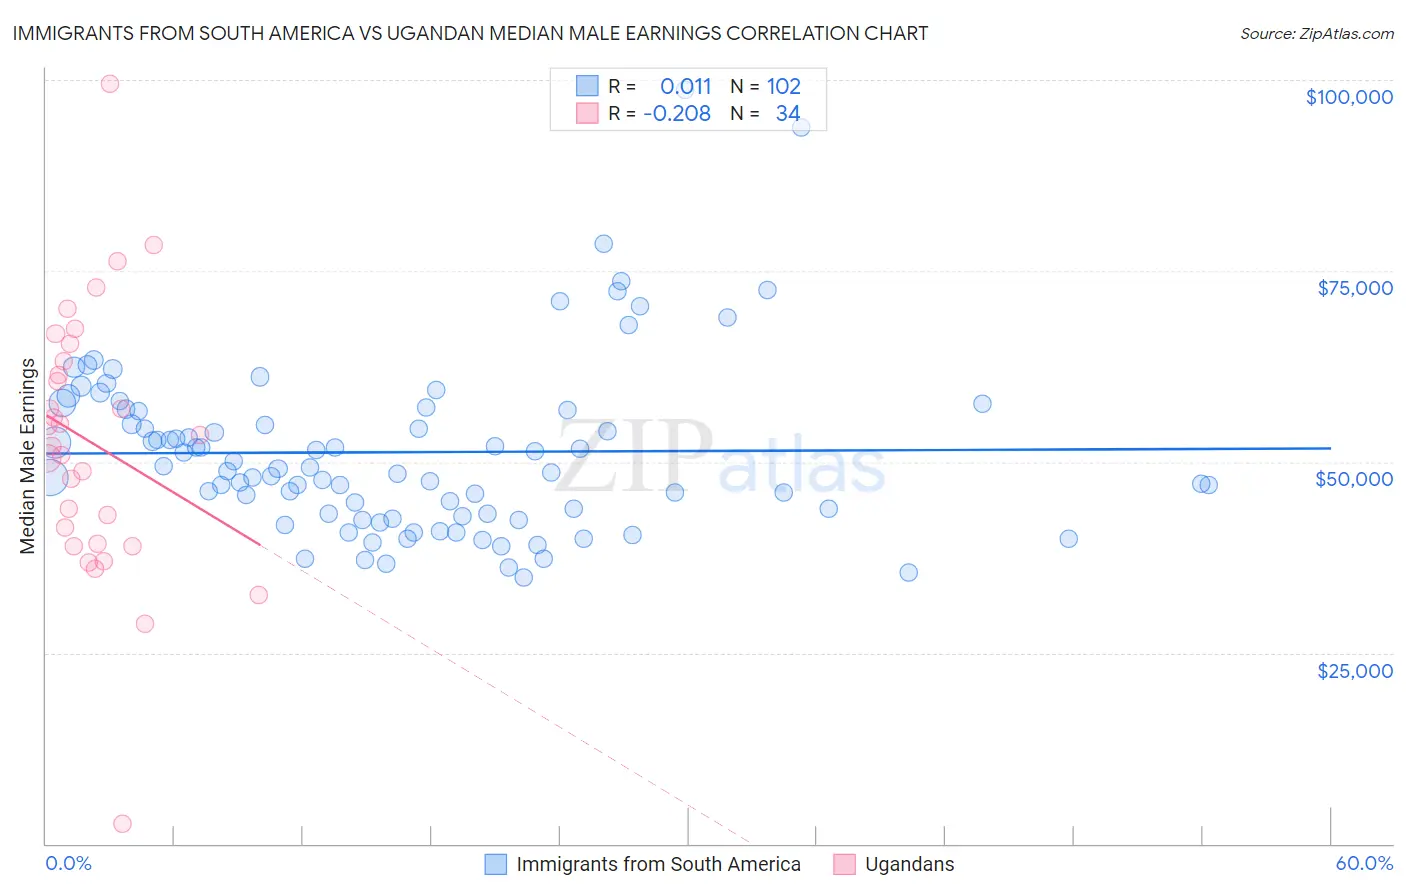
Immigrants from South America vs Ugandan Median Male Earnings Correlation Chart
The statistical analysis conducted on geographies consisting of 486,116,321 people shows no correlation between the proportion of Immigrants from South America and median male earnings in the United States with a correlation coefficient (R) of 0.011 and weighted average of $53,962. Similarly, the statistical analysis conducted on geographies consisting of 94,009,031 people shows a weak negative correlation between the proportion of Ugandans and median male earnings in the United States with a correlation coefficient (R) of -0.208 and weighted average of $55,290, a difference of 2.5%.
Median Male Earnings Correlation Summary
| Measurement | Immigrants from South America | Ugandan |
| Minimum | $34,825 | $2,614 |
| Maximum | $98,656 | $99,574 |
| Range | $63,831 | $96,960 |
| Mean | $51,267 | $52,480 |
| Median | $48,941 | $52,840 |
| Interquartile 25% (IQ1) | $43,131 | $39,217 |
| Interquartile 75% (IQ3) | $56,719 | $63,193 |
| Interquartile Range (IQR) | $13,589 | $23,975 |
| Standard Deviation (Sample) | $11,368 | $17,547 |
| Standard Deviation (Population) | $11,312 | $17,287 |
Demographics Similar to Immigrants from South America and Ugandans by Median Male Earnings
In terms of median male earnings, the demographic groups most similar to Immigrants from South America are Yugoslavian ($53,967, a difference of 0.010%), Immigrants ($54,168, a difference of 0.38%), Iraqi ($54,182, a difference of 0.41%), Celtic ($54,242, a difference of 0.52%), and Costa Rican ($54,279, a difference of 0.59%). Similarly, the demographic groups most similar to Ugandans are Immigrants from South Eastern Asia ($55,241, a difference of 0.090%), Immigrants from Portugal ($55,182, a difference of 0.20%), German ($54,974, a difference of 0.57%), Immigrants from Fiji ($54,958, a difference of 0.60%), and Immigrants from Vietnam ($54,913, a difference of 0.69%).
| Demographics | Rating | Rank | Median Male Earnings |
| Ugandans | 68.6 /100 | #163 | Good $55,290 |
| Immigrants | South Eastern Asia | 67.6 /100 | #164 | Good $55,241 |
| Immigrants | Portugal | 66.3 /100 | #165 | Good $55,182 |
| Germans | 61.6 /100 | #166 | Good $54,974 |
| Immigrants | Fiji | 61.2 /100 | #167 | Good $54,958 |
| Immigrants | Vietnam | 60.2 /100 | #168 | Good $54,913 |
| French Canadians | 55.6 /100 | #169 | Average $54,722 |
| Finns | 55.6 /100 | #170 | Average $54,721 |
| Immigrants | Peru | 54.9 /100 | #171 | Average $54,695 |
| Welsh | 53.8 /100 | #172 | Average $54,647 |
| South American Indians | 50.4 /100 | #173 | Average $54,508 |
| South Americans | 50.0 /100 | #174 | Average $54,492 |
| Dutch | 48.0 /100 | #175 | Average $54,410 |
| Spaniards | 47.8 /100 | #176 | Average $54,401 |
| Costa Ricans | 44.8 /100 | #177 | Average $54,279 |
| Sierra Leoneans | 44.8 /100 | #178 | Average $54,279 |
| Celtics | 43.9 /100 | #179 | Average $54,242 |
| Iraqis | 42.5 /100 | #180 | Average $54,182 |
| Immigrants | Immigrants | 42.1 /100 | #181 | Average $54,168 |
| Yugoslavians | 37.4 /100 | #182 | Fair $53,967 |
| Immigrants | South America | 37.3 /100 | #183 | Fair $53,962 |