Cree vs Cape Verdean Median Male Earnings
COMPARE
Cree
Cape Verdean
Median Male Earnings
Median Male Earnings Comparison
Cree
Cape Verdeans
$49,497
MEDIAN MALE EARNINGS
0.7/ 100
METRIC RATING
258th/ 347
METRIC RANK
$51,103
MEDIAN MALE EARNINGS
3.5/ 100
METRIC RATING
234th/ 347
METRIC RANK
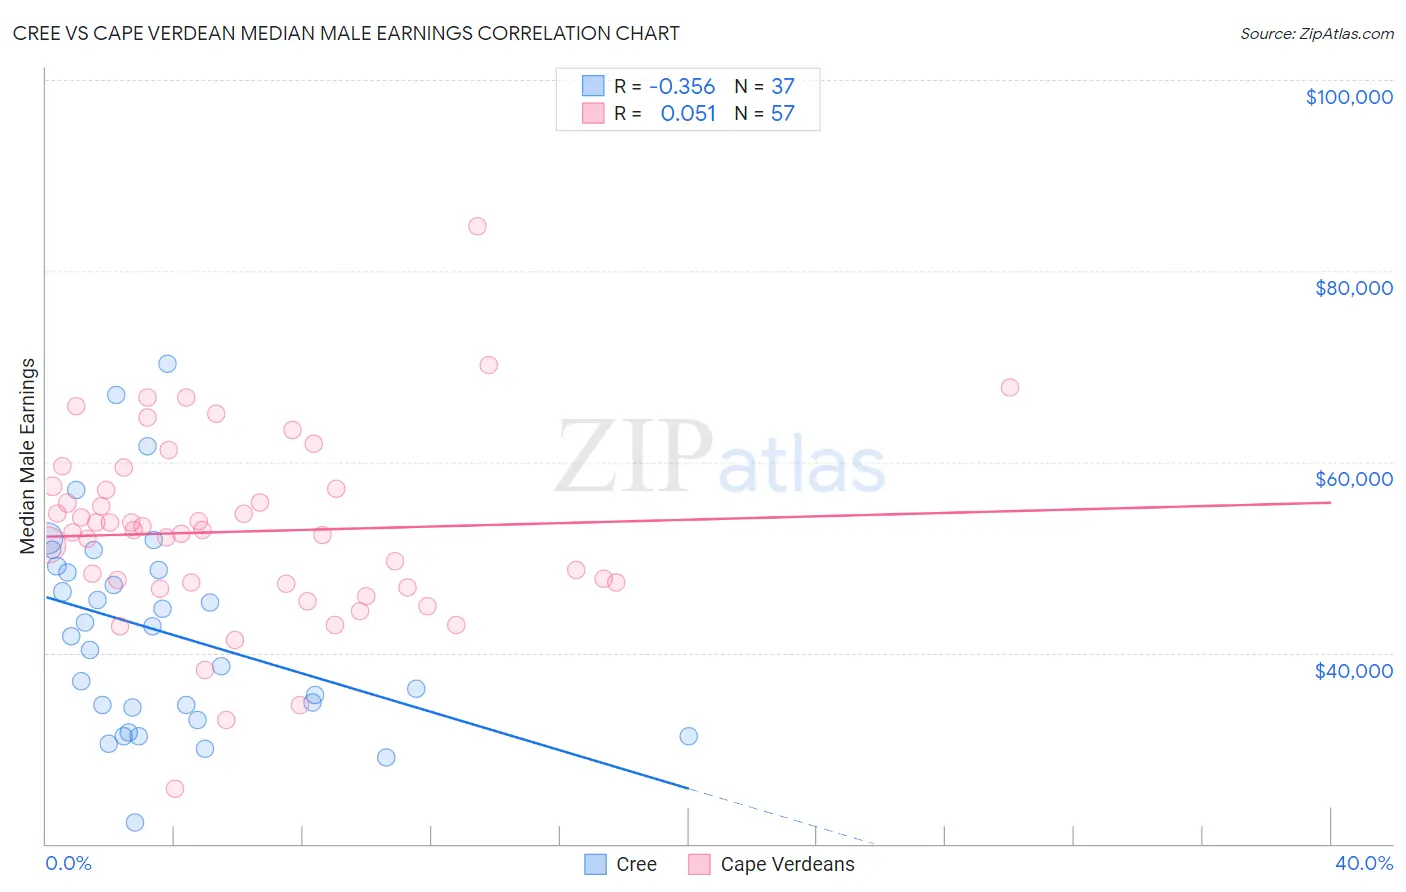
Cree vs Cape Verdean Median Male Earnings Correlation Chart
The statistical analysis conducted on geographies consisting of 76,198,776 people shows a mild negative correlation between the proportion of Cree and median male earnings in the United States with a correlation coefficient (R) of -0.356 and weighted average of $49,497. Similarly, the statistical analysis conducted on geographies consisting of 107,567,026 people shows a slight positive correlation between the proportion of Cape Verdeans and median male earnings in the United States with a correlation coefficient (R) of 0.051 and weighted average of $51,103, a difference of 3.3%.
Median Male Earnings Correlation Summary
| Measurement | Cree | Cape Verdean |
| Minimum | $22,163 | $25,819 |
| Maximum | $70,294 | $84,702 |
| Range | $48,131 | $58,883 |
| Mean | $42,158 | $52,707 |
| Median | $41,730 | $52,842 |
| Interquartile 25% (IQ1) | $33,580 | $47,020 |
| Interquartile 75% (IQ3) | $48,892 | $57,300 |
| Interquartile Range (IQR) | $15,312 | $10,280 |
| Standard Deviation (Sample) | $10,951 | $9,854 |
| Standard Deviation (Population) | $10,802 | $9,767 |
Similar Demographics by Median Male Earnings
Demographics Similar to Cree by Median Male Earnings
In terms of median male earnings, the demographic groups most similar to Cree are Nepalese ($49,458, a difference of 0.080%), Iroquois ($49,374, a difference of 0.25%), British West Indian ($49,636, a difference of 0.28%), Liberian ($49,318, a difference of 0.36%), and Alaska Native ($49,711, a difference of 0.43%).
| Demographics | Rating | Rank | Median Male Earnings |
| Immigrants | Grenada | 1.6 /100 | #251 | Tragic $50,279 |
| Immigrants | Cabo Verde | 1.2 /100 | #252 | Tragic $50,009 |
| German Russians | 1.1 /100 | #253 | Tragic $49,924 |
| Senegalese | 1.0 /100 | #254 | Tragic $49,774 |
| Alaskan Athabascans | 0.9 /100 | #255 | Tragic $49,748 |
| Alaska Natives | 0.9 /100 | #256 | Tragic $49,711 |
| British West Indians | 0.8 /100 | #257 | Tragic $49,636 |
| Cree | 0.7 /100 | #258 | Tragic $49,497 |
| Nepalese | 0.7 /100 | #259 | Tragic $49,458 |
| Iroquois | 0.7 /100 | #260 | Tragic $49,374 |
| Liberians | 0.6 /100 | #261 | Tragic $49,318 |
| Immigrants | West Indies | 0.6 /100 | #262 | Tragic $49,271 |
| Nicaraguans | 0.6 /100 | #263 | Tragic $49,215 |
| Immigrants | Middle Africa | 0.6 /100 | #264 | Tragic $49,201 |
| Immigrants | Laos | 0.6 /100 | #265 | Tragic $49,190 |
Demographics Similar to Cape Verdeans by Median Male Earnings
In terms of median male earnings, the demographic groups most similar to Cape Verdeans are Aleut ($51,168, a difference of 0.13%), Sudanese ($51,216, a difference of 0.22%), Barbadian ($51,236, a difference of 0.26%), Immigrants from Western Africa ($50,940, a difference of 0.32%), and Immigrants from Nigeria ($51,310, a difference of 0.40%).
| Demographics | Rating | Rank | Median Male Earnings |
| Trinidadians and Tobagonians | 4.8 /100 | #227 | Tragic $51,446 |
| Samoans | 4.6 /100 | #228 | Tragic $51,389 |
| Immigrants | Trinidad and Tobago | 4.5 /100 | #229 | Tragic $51,376 |
| Immigrants | Nigeria | 4.2 /100 | #230 | Tragic $51,310 |
| Barbadians | 3.9 /100 | #231 | Tragic $51,236 |
| Sudanese | 3.9 /100 | #232 | Tragic $51,216 |
| Aleuts | 3.7 /100 | #233 | Tragic $51,168 |
| Cape Verdeans | 3.5 /100 | #234 | Tragic $51,103 |
| Immigrants | Western Africa | 3.0 /100 | #235 | Tragic $50,940 |
| Pennsylvania Germans | 2.8 /100 | #236 | Tragic $50,878 |
| Immigrants | Barbados | 2.6 /100 | #237 | Tragic $50,795 |
| Malaysians | 2.5 /100 | #238 | Tragic $50,772 |
| Americans | 2.5 /100 | #239 | Tragic $50,761 |
| West Indians | 2.3 /100 | #240 | Tragic $50,682 |
| Immigrants | St. Vincent and the Grenadines | 2.3 /100 | #241 | Tragic $50,665 |