Immigrants from Senegal vs Ugandan Median Male Earnings
COMPARE
Immigrants from Senegal
Ugandan
Median Male Earnings
Median Male Earnings Comparison
Immigrants from Senegal
Ugandans
$51,647
MEDIAN MALE EARNINGS
5.8/ 100
METRIC RATING
221st/ 347
METRIC RANK
$55,290
MEDIAN MALE EARNINGS
68.6/ 100
METRIC RATING
163rd/ 347
METRIC RANK
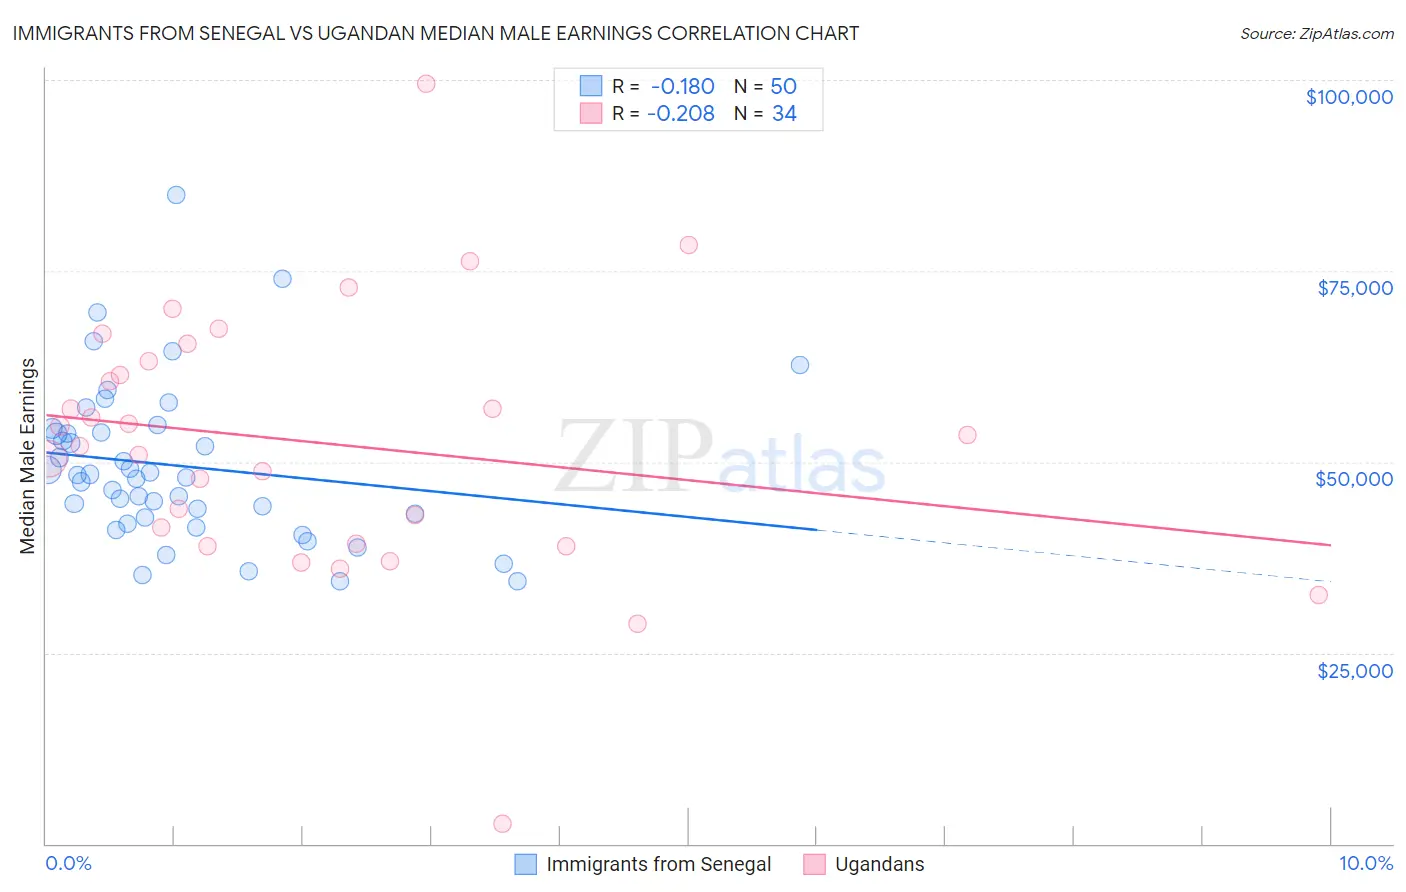
Immigrants from Senegal vs Ugandan Median Male Earnings Correlation Chart
The statistical analysis conducted on geographies consisting of 90,120,313 people shows a poor negative correlation between the proportion of Immigrants from Senegal and median male earnings in the United States with a correlation coefficient (R) of -0.180 and weighted average of $51,647. Similarly, the statistical analysis conducted on geographies consisting of 94,009,031 people shows a weak negative correlation between the proportion of Ugandans and median male earnings in the United States with a correlation coefficient (R) of -0.208 and weighted average of $55,290, a difference of 7.0%.
Median Male Earnings Correlation Summary
| Measurement | Immigrants from Senegal | Ugandan |
| Minimum | $34,387 | $2,614 |
| Maximum | $84,866 | $99,574 |
| Range | $50,479 | $96,960 |
| Mean | $49,446 | $52,480 |
| Median | $48,099 | $52,840 |
| Interquartile 25% (IQ1) | $42,790 | $39,217 |
| Interquartile 75% (IQ3) | $53,838 | $63,193 |
| Interquartile Range (IQR) | $11,049 | $23,975 |
| Standard Deviation (Sample) | $10,360 | $17,547 |
| Standard Deviation (Population) | $10,256 | $17,287 |
Similar Demographics by Median Male Earnings
Demographics Similar to Immigrants from Senegal by Median Male Earnings
In terms of median male earnings, the demographic groups most similar to Immigrants from Senegal are Immigrants from Bangladesh ($51,642, a difference of 0.010%), Ecuadorian ($51,596, a difference of 0.10%), Immigrants from Cambodia ($51,594, a difference of 0.10%), Immigrants from Armenia ($51,793, a difference of 0.28%), and Immigrants from Sudan ($51,489, a difference of 0.31%).
| Demographics | Rating | Rank | Median Male Earnings |
| Immigrants | Nonimmigrants | 9.3 /100 | #214 | Tragic $52,170 |
| Immigrants | Cameroon | 8.9 /100 | #215 | Tragic $52,119 |
| Immigrants | Venezuela | 8.3 /100 | #216 | Tragic $52,041 |
| Nigerians | 8.3 /100 | #217 | Tragic $52,039 |
| Immigrants | Panama | 7.7 /100 | #218 | Tragic $51,962 |
| Immigrants | Ghana | 6.9 /100 | #219 | Tragic $51,836 |
| Immigrants | Armenia | 6.6 /100 | #220 | Tragic $51,793 |
| Immigrants | Senegal | 5.8 /100 | #221 | Tragic $51,647 |
| Immigrants | Bangladesh | 5.8 /100 | #222 | Tragic $51,642 |
| Ecuadorians | 5.5 /100 | #223 | Tragic $51,596 |
| Immigrants | Cambodia | 5.5 /100 | #224 | Tragic $51,594 |
| Immigrants | Sudan | 5.0 /100 | #225 | Tragic $51,489 |
| Japanese | 4.9 /100 | #226 | Tragic $51,473 |
| Trinidadians and Tobagonians | 4.8 /100 | #227 | Tragic $51,446 |
| Samoans | 4.6 /100 | #228 | Tragic $51,389 |
Demographics Similar to Ugandans by Median Male Earnings
In terms of median male earnings, the demographic groups most similar to Ugandans are Immigrants from South Eastern Asia ($55,241, a difference of 0.090%), French ($55,350, a difference of 0.11%), Belgian ($55,361, a difference of 0.13%), Basque ($55,370, a difference of 0.15%), and Alsatian ($55,380, a difference of 0.16%).
| Demographics | Rating | Rank | Median Male Earnings |
| Immigrants | Ethiopia | 71.6 /100 | #156 | Good $55,434 |
| Icelanders | 71.2 /100 | #157 | Good $55,415 |
| Czechoslovakians | 70.5 /100 | #158 | Good $55,382 |
| Alsatians | 70.5 /100 | #159 | Good $55,380 |
| Basques | 70.3 /100 | #160 | Good $55,370 |
| Belgians | 70.1 /100 | #161 | Good $55,361 |
| French | 69.9 /100 | #162 | Good $55,350 |
| Ugandans | 68.6 /100 | #163 | Good $55,290 |
| Immigrants | South Eastern Asia | 67.6 /100 | #164 | Good $55,241 |
| Immigrants | Portugal | 66.3 /100 | #165 | Good $55,182 |
| Germans | 61.6 /100 | #166 | Good $54,974 |
| Immigrants | Fiji | 61.2 /100 | #167 | Good $54,958 |
| Immigrants | Vietnam | 60.2 /100 | #168 | Good $54,913 |
| French Canadians | 55.6 /100 | #169 | Average $54,722 |
| Finns | 55.6 /100 | #170 | Average $54,721 |