Immigrants from Brazil vs Syrian Median Family Income
COMPARE
Immigrants from Brazil
Syrian
Median Family Income
Median Family Income Comparison
Immigrants from Brazil
Syrians
$109,418
MEDIAN FAMILY INCOME
96.9/ 100
METRIC RATING
103rd/ 347
METRIC RANK
$109,299
MEDIAN FAMILY INCOME
96.7/ 100
METRIC RATING
105th/ 347
METRIC RANK
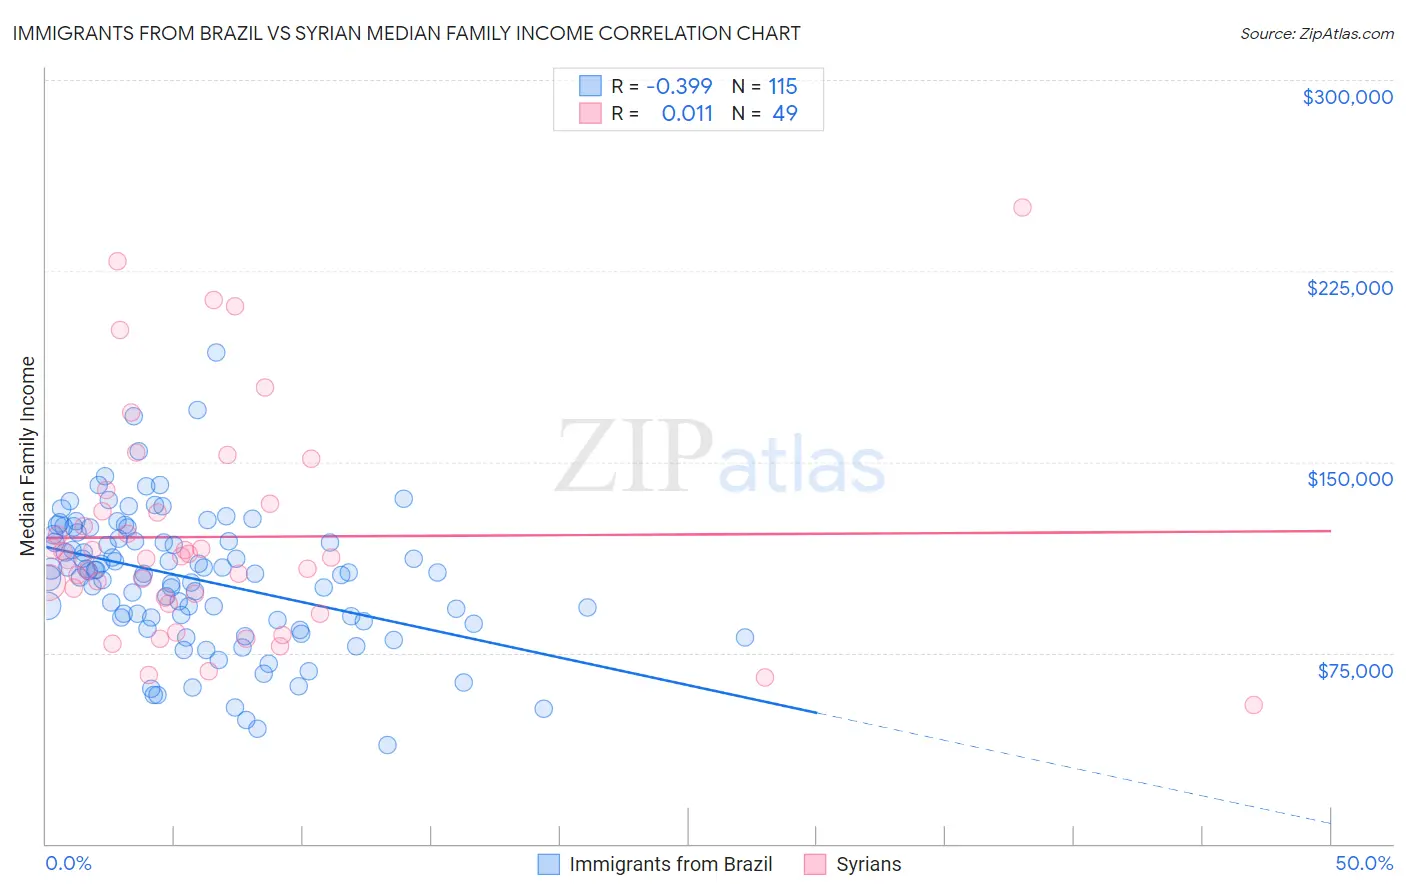
Immigrants from Brazil vs Syrian Median Family Income Correlation Chart
The statistical analysis conducted on geographies consisting of 342,786,060 people shows a mild negative correlation between the proportion of Immigrants from Brazil and median family income in the United States with a correlation coefficient (R) of -0.399 and weighted average of $109,418. Similarly, the statistical analysis conducted on geographies consisting of 266,121,258 people shows no correlation between the proportion of Syrians and median family income in the United States with a correlation coefficient (R) of 0.011 and weighted average of $109,299, a difference of 0.11%.
Median Family Income Correlation Summary
| Measurement | Immigrants from Brazil | Syrian |
| Minimum | $38,641 | $54,375 |
| Maximum | $192,802 | $250,001 |
| Range | $154,161 | $195,626 |
| Mean | $103,935 | $120,507 |
| Median | $106,400 | $112,639 |
| Interquartile 25% (IQ1) | $87,917 | $95,409 |
| Interquartile 75% (IQ3) | $121,341 | $132,003 |
| Interquartile Range (IQR) | $33,424 | $36,594 |
| Standard Deviation (Sample) | $26,654 | $43,231 |
| Standard Deviation (Population) | $26,538 | $42,788 |
Demographics Similar to Immigrants from Brazil and Syrians by Median Family Income
In terms of median family income, the demographic groups most similar to Immigrants from Brazil are Palestinian ($109,413, a difference of 0.0%), Assyrian/Chaldean/Syriac ($109,622, a difference of 0.19%), Immigrants from Ukraine ($109,645, a difference of 0.21%), Macedonian ($109,668, a difference of 0.23%), and Armenian ($109,692, a difference of 0.25%). Similarly, the demographic groups most similar to Syrians are Palestinian ($109,413, a difference of 0.10%), Albanian ($109,136, a difference of 0.15%), Immigrants from North Macedonia ($109,136, a difference of 0.15%), Assyrian/Chaldean/Syriac ($109,622, a difference of 0.30%), and Immigrants from Ukraine ($109,645, a difference of 0.32%).
| Demographics | Rating | Rank | Median Family Income |
| Koreans | 97.8 /100 | #94 | Exceptional $110,103 |
| Zimbabweans | 97.7 /100 | #95 | Exceptional $110,011 |
| Immigrants | Moldova | 97.7 /100 | #96 | Exceptional $109,975 |
| Jordanians | 97.5 /100 | #97 | Exceptional $109,865 |
| Immigrants | Kuwait | 97.4 /100 | #98 | Exceptional $109,731 |
| Armenians | 97.3 /100 | #99 | Exceptional $109,692 |
| Macedonians | 97.3 /100 | #100 | Exceptional $109,668 |
| Immigrants | Ukraine | 97.2 /100 | #101 | Exceptional $109,645 |
| Assyrians/Chaldeans/Syriacs | 97.2 /100 | #102 | Exceptional $109,622 |
| Immigrants | Brazil | 96.9 /100 | #103 | Exceptional $109,418 |
| Palestinians | 96.9 /100 | #104 | Exceptional $109,413 |
| Syrians | 96.7 /100 | #105 | Exceptional $109,299 |
| Albanians | 96.4 /100 | #106 | Exceptional $109,136 |
| Immigrants | North Macedonia | 96.4 /100 | #107 | Exceptional $109,136 |
| Immigrants | Zimbabwe | 95.9 /100 | #108 | Exceptional $108,830 |
| Immigrants | Afghanistan | 95.6 /100 | #109 | Exceptional $108,709 |
| British | 95.6 /100 | #110 | Exceptional $108,705 |
| Immigrants | Western Asia | 95.6 /100 | #111 | Exceptional $108,691 |
| Immigrants | Poland | 95.3 /100 | #112 | Exceptional $108,570 |
| Immigrants | Saudi Arabia | 95.2 /100 | #113 | Exceptional $108,544 |
| Poles | 95.2 /100 | #114 | Exceptional $108,507 |