Slovene vs Syrian Median Family Income
COMPARE
Slovene
Syrian
Median Family Income
Median Family Income Comparison
Slovenes
Syrians
$106,020
MEDIAN FAMILY INCOME
84.7/ 100
METRIC RATING
142nd/ 347
METRIC RANK
$109,299
MEDIAN FAMILY INCOME
96.7/ 100
METRIC RATING
105th/ 347
METRIC RANK
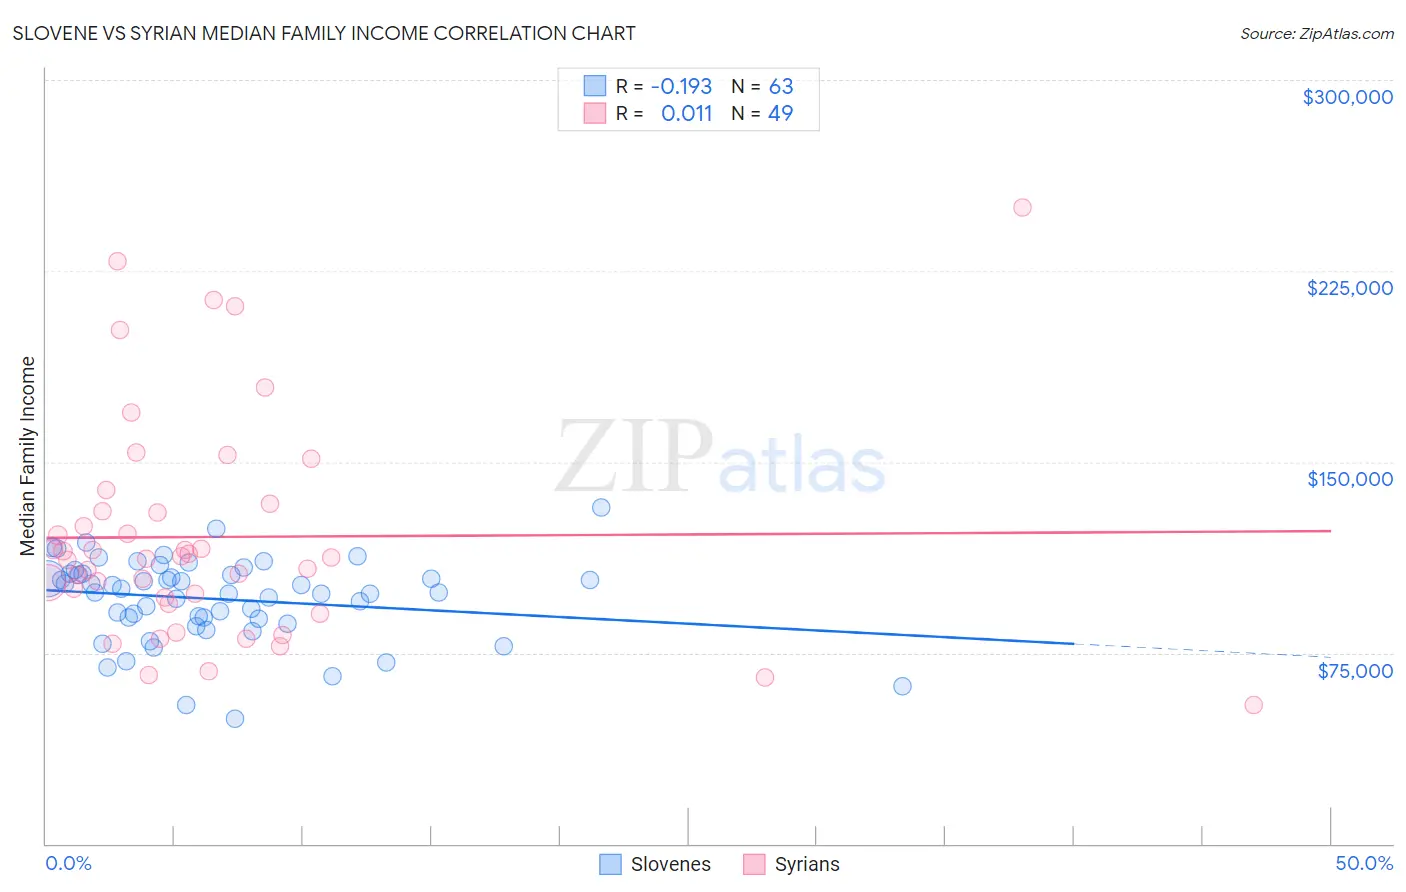
Slovene vs Syrian Median Family Income Correlation Chart
The statistical analysis conducted on geographies consisting of 261,214,906 people shows a poor negative correlation between the proportion of Slovenes and median family income in the United States with a correlation coefficient (R) of -0.193 and weighted average of $106,020. Similarly, the statistical analysis conducted on geographies consisting of 266,121,258 people shows no correlation between the proportion of Syrians and median family income in the United States with a correlation coefficient (R) of 0.011 and weighted average of $109,299, a difference of 3.1%.
Median Family Income Correlation Summary
| Measurement | Slovene | Syrian |
| Minimum | $48,984 | $54,375 |
| Maximum | $132,096 | $250,001 |
| Range | $83,112 | $195,626 |
| Mean | $96,087 | $120,507 |
| Median | $98,910 | $112,639 |
| Interquartile 25% (IQ1) | $88,135 | $95,409 |
| Interquartile 75% (IQ3) | $105,910 | $132,003 |
| Interquartile Range (IQR) | $17,775 | $36,594 |
| Standard Deviation (Sample) | $16,283 | $43,231 |
| Standard Deviation (Population) | $16,153 | $42,788 |
Similar Demographics by Median Family Income
Demographics Similar to Slovenes by Median Family Income
In terms of median family income, the demographic groups most similar to Slovenes are Tongan ($105,967, a difference of 0.050%), Immigrants from Morocco ($105,964, a difference of 0.050%), Immigrants from Syria ($106,118, a difference of 0.090%), Danish ($105,900, a difference of 0.11%), and Norwegian ($106,144, a difference of 0.12%).
| Demographics | Rating | Rank | Median Family Income |
| Portuguese | 86.3 /100 | #135 | Excellent $106,286 |
| Immigrants | South Eastern Asia | 86.1 /100 | #136 | Excellent $106,252 |
| Immigrants | Uganda | 85.7 /100 | #137 | Excellent $106,188 |
| Immigrants | Vietnam | 85.7 /100 | #138 | Excellent $106,186 |
| Luxembourgers | 85.7 /100 | #139 | Excellent $106,183 |
| Norwegians | 85.5 /100 | #140 | Excellent $106,144 |
| Immigrants | Syria | 85.3 /100 | #141 | Excellent $106,118 |
| Slovenes | 84.7 /100 | #142 | Excellent $106,020 |
| Tongans | 84.3 /100 | #143 | Excellent $105,967 |
| Immigrants | Morocco | 84.3 /100 | #144 | Excellent $105,964 |
| Danes | 83.8 /100 | #145 | Excellent $105,900 |
| Czechs | 83.4 /100 | #146 | Excellent $105,839 |
| Immigrants | Chile | 82.1 /100 | #147 | Excellent $105,655 |
| Hungarians | 81.7 /100 | #148 | Excellent $105,609 |
| Immigrants | Germany | 80.9 /100 | #149 | Excellent $105,507 |
Demographics Similar to Syrians by Median Family Income
In terms of median family income, the demographic groups most similar to Syrians are Palestinian ($109,413, a difference of 0.10%), Immigrants from Brazil ($109,418, a difference of 0.11%), Albanian ($109,136, a difference of 0.15%), Immigrants from North Macedonia ($109,136, a difference of 0.15%), and Assyrian/Chaldean/Syriac ($109,622, a difference of 0.30%).
| Demographics | Rating | Rank | Median Family Income |
| Immigrants | Kuwait | 97.4 /100 | #98 | Exceptional $109,731 |
| Armenians | 97.3 /100 | #99 | Exceptional $109,692 |
| Macedonians | 97.3 /100 | #100 | Exceptional $109,668 |
| Immigrants | Ukraine | 97.2 /100 | #101 | Exceptional $109,645 |
| Assyrians/Chaldeans/Syriacs | 97.2 /100 | #102 | Exceptional $109,622 |
| Immigrants | Brazil | 96.9 /100 | #103 | Exceptional $109,418 |
| Palestinians | 96.9 /100 | #104 | Exceptional $109,413 |
| Syrians | 96.7 /100 | #105 | Exceptional $109,299 |
| Albanians | 96.4 /100 | #106 | Exceptional $109,136 |
| Immigrants | North Macedonia | 96.4 /100 | #107 | Exceptional $109,136 |
| Immigrants | Zimbabwe | 95.9 /100 | #108 | Exceptional $108,830 |
| Immigrants | Afghanistan | 95.6 /100 | #109 | Exceptional $108,709 |
| British | 95.6 /100 | #110 | Exceptional $108,705 |
| Immigrants | Western Asia | 95.6 /100 | #111 | Exceptional $108,691 |
| Immigrants | Poland | 95.3 /100 | #112 | Exceptional $108,570 |