Cree vs South African Householder Income Ages 45 - 64 years
COMPARE
Cree
South African
Householder Income Ages 45 - 64 years
Householder Income Ages 45 - 64 years Comparison
Cree
South Africans
$87,185
HOUSEHOLDER INCOME AGES 45 - 64 YEARS
0.1/ 100
METRIC RATING
277th/ 347
METRIC RANK
$109,719
HOUSEHOLDER INCOME AGES 45 - 64 YEARS
99.1/ 100
METRIC RATING
75th/ 347
METRIC RANK
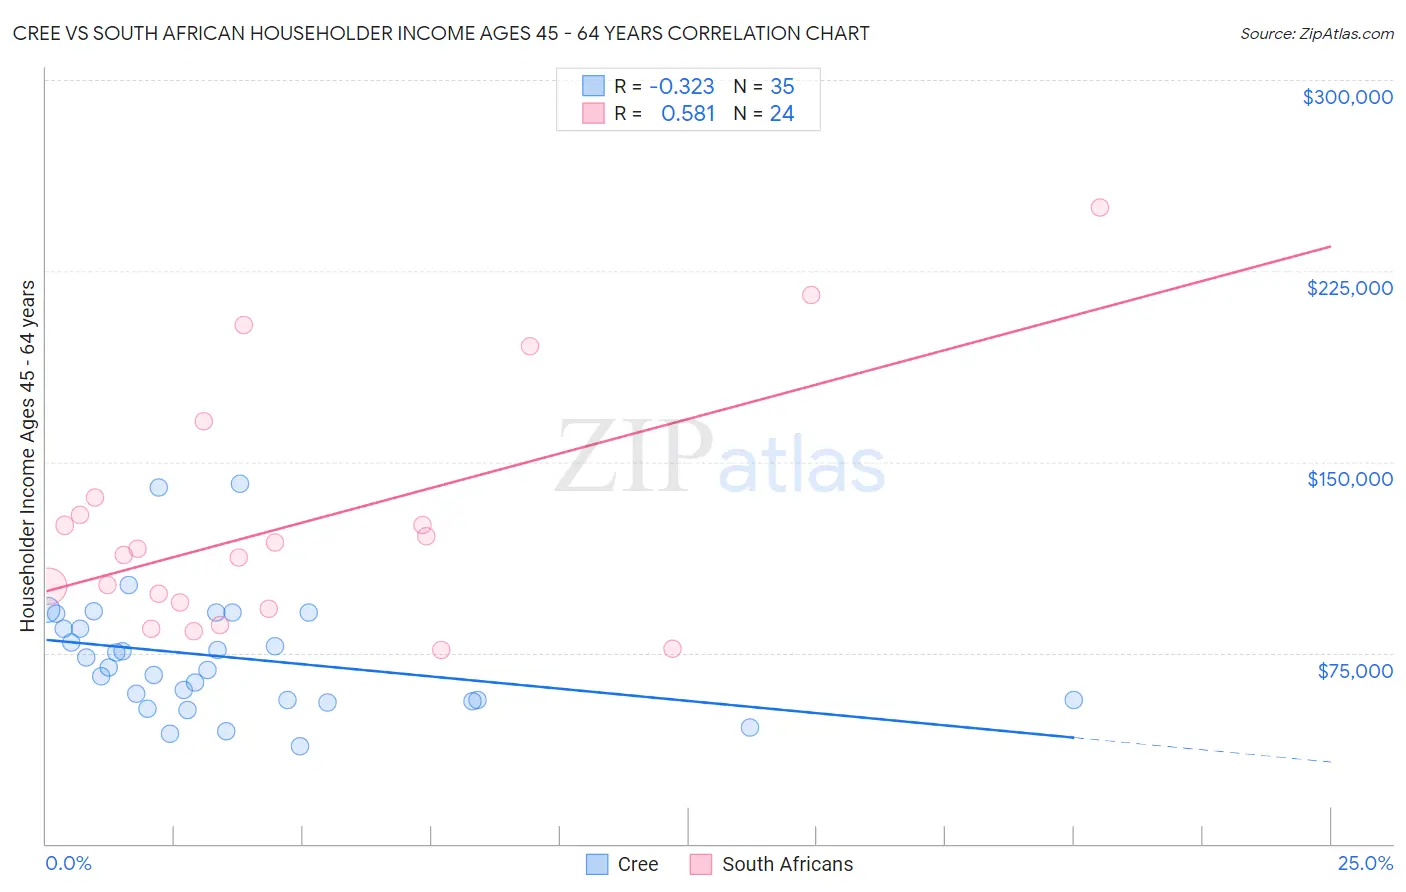
Cree vs South African Householder Income Ages 45 - 64 years Correlation Chart
The statistical analysis conducted on geographies consisting of 76,173,826 people shows a mild negative correlation between the proportion of Cree and household income with householder between the ages 45 and 64 in the United States with a correlation coefficient (R) of -0.323 and weighted average of $87,185. Similarly, the statistical analysis conducted on geographies consisting of 182,453,262 people shows a substantial positive correlation between the proportion of South Africans and household income with householder between the ages 45 and 64 in the United States with a correlation coefficient (R) of 0.581 and weighted average of $109,719, a difference of 25.9%.
Householder Income Ages 45 - 64 years Correlation Summary
| Measurement | Cree | South African |
| Minimum | $38,125 | $76,250 |
| Maximum | $141,447 | $250,001 |
| Range | $103,322 | $173,751 |
| Mean | $73,266 | $125,894 |
| Median | $69,060 | $114,605 |
| Interquartile 25% (IQ1) | $56,250 | $93,424 |
| Interquartile 75% (IQ3) | $90,223 | $132,734 |
| Interquartile Range (IQR) | $33,973 | $39,311 |
| Standard Deviation (Sample) | $23,520 | $46,946 |
| Standard Deviation (Population) | $23,182 | $45,958 |
Similar Demographics by Householder Income Ages 45 - 64 years
Demographics Similar to Cree by Householder Income Ages 45 - 64 years
In terms of householder income ages 45 - 64 years, the demographic groups most similar to Cree are Immigrants from Latin America ($87,219, a difference of 0.040%), Immigrants from Belize ($87,229, a difference of 0.050%), Iroquois ($87,255, a difference of 0.080%), Immigrants from Jamaica ($87,035, a difference of 0.17%), and Yakama ($86,992, a difference of 0.22%).
| Demographics | Rating | Rank | Householder Income Ages 45 - 64 years |
| Immigrants | Liberia | 0.2 /100 | #270 | Tragic $87,739 |
| Guatemalans | 0.2 /100 | #271 | Tragic $87,705 |
| Cape Verdeans | 0.2 /100 | #272 | Tragic $87,580 |
| Spanish American Indians | 0.2 /100 | #273 | Tragic $87,561 |
| Iroquois | 0.1 /100 | #274 | Tragic $87,255 |
| Immigrants | Belize | 0.1 /100 | #275 | Tragic $87,229 |
| Immigrants | Latin America | 0.1 /100 | #276 | Tragic $87,219 |
| Cree | 0.1 /100 | #277 | Tragic $87,185 |
| Immigrants | Jamaica | 0.1 /100 | #278 | Tragic $87,035 |
| Yakama | 0.1 /100 | #279 | Tragic $86,992 |
| Immigrants | Somalia | 0.1 /100 | #280 | Tragic $86,987 |
| Yaqui | 0.1 /100 | #281 | Tragic $86,914 |
| Senegalese | 0.1 /100 | #282 | Tragic $86,897 |
| Mexicans | 0.1 /100 | #283 | Tragic $86,816 |
| Central American Indians | 0.1 /100 | #284 | Tragic $86,764 |
Demographics Similar to South Africans by Householder Income Ages 45 - 64 years
In terms of householder income ages 45 - 64 years, the demographic groups most similar to South Africans are Immigrants from Egypt ($109,941, a difference of 0.20%), Paraguayan ($109,447, a difference of 0.25%), Immigrants from England ($109,446, a difference of 0.25%), Immigrants from Canada ($109,402, a difference of 0.29%), and Immigrants from Bulgaria ($109,379, a difference of 0.31%).
| Demographics | Rating | Rank | Householder Income Ages 45 - 64 years |
| Immigrants | Romania | 99.4 /100 | #68 | Exceptional $110,633 |
| Immigrants | Italy | 99.4 /100 | #69 | Exceptional $110,434 |
| Koreans | 99.3 /100 | #70 | Exceptional $110,334 |
| Italians | 99.3 /100 | #71 | Exceptional $110,224 |
| Assyrians/Chaldeans/Syriacs | 99.3 /100 | #72 | Exceptional $110,201 |
| Argentineans | 99.3 /100 | #73 | Exceptional $110,103 |
| Immigrants | Egypt | 99.2 /100 | #74 | Exceptional $109,941 |
| South Africans | 99.1 /100 | #75 | Exceptional $109,719 |
| Paraguayans | 99.0 /100 | #76 | Exceptional $109,447 |
| Immigrants | England | 99.0 /100 | #77 | Exceptional $109,446 |
| Immigrants | Canada | 99.0 /100 | #78 | Exceptional $109,402 |
| Immigrants | Bulgaria | 98.9 /100 | #79 | Exceptional $109,379 |
| Jordanians | 98.9 /100 | #80 | Exceptional $109,376 |
| Immigrants | Eastern Europe | 98.9 /100 | #81 | Exceptional $109,335 |
| Immigrants | North America | 98.8 /100 | #82 | Exceptional $109,198 |