Immigrants from Eastern Africa vs Nigerian Householder Income Ages 45 - 64 years
COMPARE
Immigrants from Eastern Africa
Nigerian
Householder Income Ages 45 - 64 years
Householder Income Ages 45 - 64 years Comparison
Immigrants from Eastern Africa
Nigerians
$98,467
HOUSEHOLDER INCOME AGES 45 - 64 YEARS
28.3/ 100
METRIC RATING
196th/ 347
METRIC RANK
$95,492
HOUSEHOLDER INCOME AGES 45 - 64 YEARS
8.2/ 100
METRIC RATING
215th/ 347
METRIC RANK
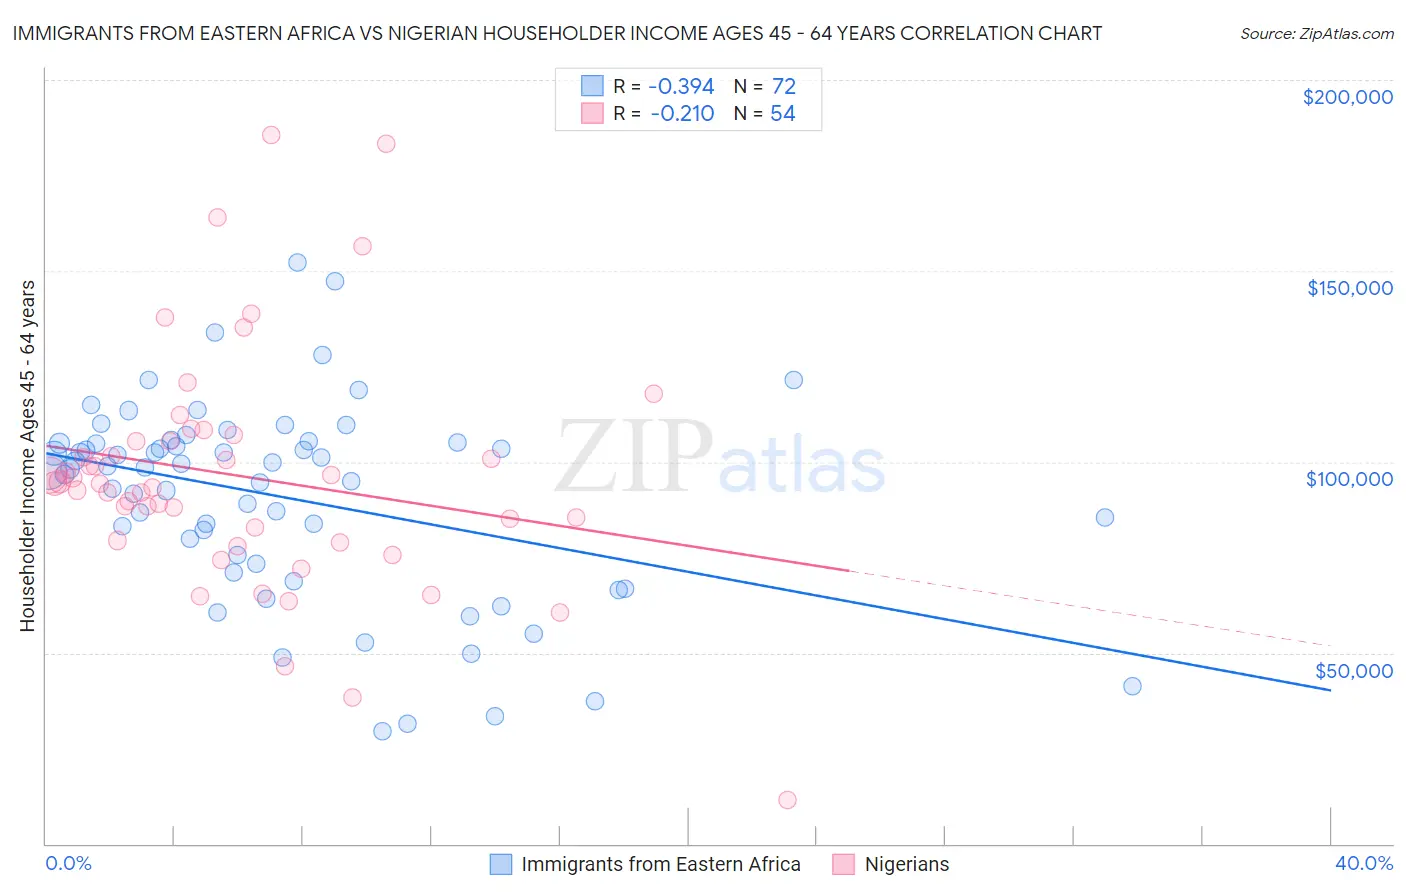
Immigrants from Eastern Africa vs Nigerian Householder Income Ages 45 - 64 years Correlation Chart
The statistical analysis conducted on geographies consisting of 354,576,754 people shows a mild negative correlation between the proportion of Immigrants from Eastern Africa and household income with householder between the ages 45 and 64 in the United States with a correlation coefficient (R) of -0.394 and weighted average of $98,467. Similarly, the statistical analysis conducted on geographies consisting of 332,111,540 people shows a weak negative correlation between the proportion of Nigerians and household income with householder between the ages 45 and 64 in the United States with a correlation coefficient (R) of -0.210 and weighted average of $95,492, a difference of 3.1%.
Householder Income Ages 45 - 64 years Correlation Summary
| Measurement | Immigrants from Eastern Africa | Nigerian |
| Minimum | $29,590 | $11,458 |
| Maximum | $152,098 | $185,761 |
| Range | $122,508 | $174,303 |
| Mean | $90,687 | $96,275 |
| Median | $98,438 | $94,283 |
| Interquartile 25% (IQ1) | $74,490 | $79,390 |
| Interquartile 75% (IQ3) | $104,938 | $105,427 |
| Interquartile Range (IQR) | $30,447 | $26,037 |
| Standard Deviation (Sample) | $25,936 | $31,417 |
| Standard Deviation (Population) | $25,755 | $31,125 |
Demographics Similar to Immigrants from Eastern Africa and Nigerians by Householder Income Ages 45 - 64 years
In terms of householder income ages 45 - 64 years, the demographic groups most similar to Immigrants from Eastern Africa are Spanish ($98,554, a difference of 0.090%), Puget Sound Salish ($98,340, a difference of 0.13%), Immigrants from Iraq ($98,201, a difference of 0.27%), White/Caucasian ($98,091, a difference of 0.38%), and Immigrants from Kenya ($97,964, a difference of 0.51%). Similarly, the demographic groups most similar to Nigerians are Panamanian ($96,066, a difference of 0.60%), Immigrants from Uruguay ($96,086, a difference of 0.62%), Venezuelan ($96,460, a difference of 1.0%), Immigrants from Cambodia ($96,537, a difference of 1.1%), and Tsimshian ($96,783, a difference of 1.3%).
| Demographics | Rating | Rank | Householder Income Ages 45 - 64 years |
| Spanish | 29.2 /100 | #195 | Fair $98,554 |
| Immigrants | Eastern Africa | 28.3 /100 | #196 | Fair $98,467 |
| Puget Sound Salish | 27.0 /100 | #197 | Fair $98,340 |
| Immigrants | Iraq | 25.7 /100 | #198 | Fair $98,201 |
| Whites/Caucasians | 24.6 /100 | #199 | Fair $98,091 |
| Immigrants | Kenya | 23.5 /100 | #200 | Fair $97,964 |
| Yugoslavians | 20.0 /100 | #201 | Fair $97,558 |
| Tlingit-Haida | 18.9 /100 | #202 | Poor $97,417 |
| Immigrants | Thailand | 18.8 /100 | #203 | Poor $97,400 |
| Immigrants | Eritrea | 18.6 /100 | #204 | Poor $97,373 |
| Immigrants | Colombia | 18.0 /100 | #205 | Poor $97,290 |
| Immigrants | Africa | 17.9 /100 | #206 | Poor $97,284 |
| Ghanaians | 17.9 /100 | #207 | Poor $97,277 |
| Scotch-Irish | 16.4 /100 | #208 | Poor $97,073 |
| Japanese | 14.8 /100 | #209 | Poor $96,834 |
| Tsimshian | 14.5 /100 | #210 | Poor $96,783 |
| Immigrants | Cambodia | 13.0 /100 | #211 | Poor $96,537 |
| Venezuelans | 12.6 /100 | #212 | Poor $96,460 |
| Immigrants | Uruguay | 10.7 /100 | #213 | Poor $96,086 |
| Panamanians | 10.6 /100 | #214 | Poor $96,066 |
| Nigerians | 8.2 /100 | #215 | Tragic $95,492 |