Costa Rican vs Nigerian Householder Income Ages 45 - 64 years
COMPARE
Costa Rican
Nigerian
Householder Income Ages 45 - 64 years
Householder Income Ages 45 - 64 years Comparison
Costa Ricans
Nigerians
$102,779
HOUSEHOLDER INCOME AGES 45 - 64 YEARS
77.4/ 100
METRIC RATING
155th/ 347
METRIC RANK
$95,492
HOUSEHOLDER INCOME AGES 45 - 64 YEARS
8.2/ 100
METRIC RATING
215th/ 347
METRIC RANK
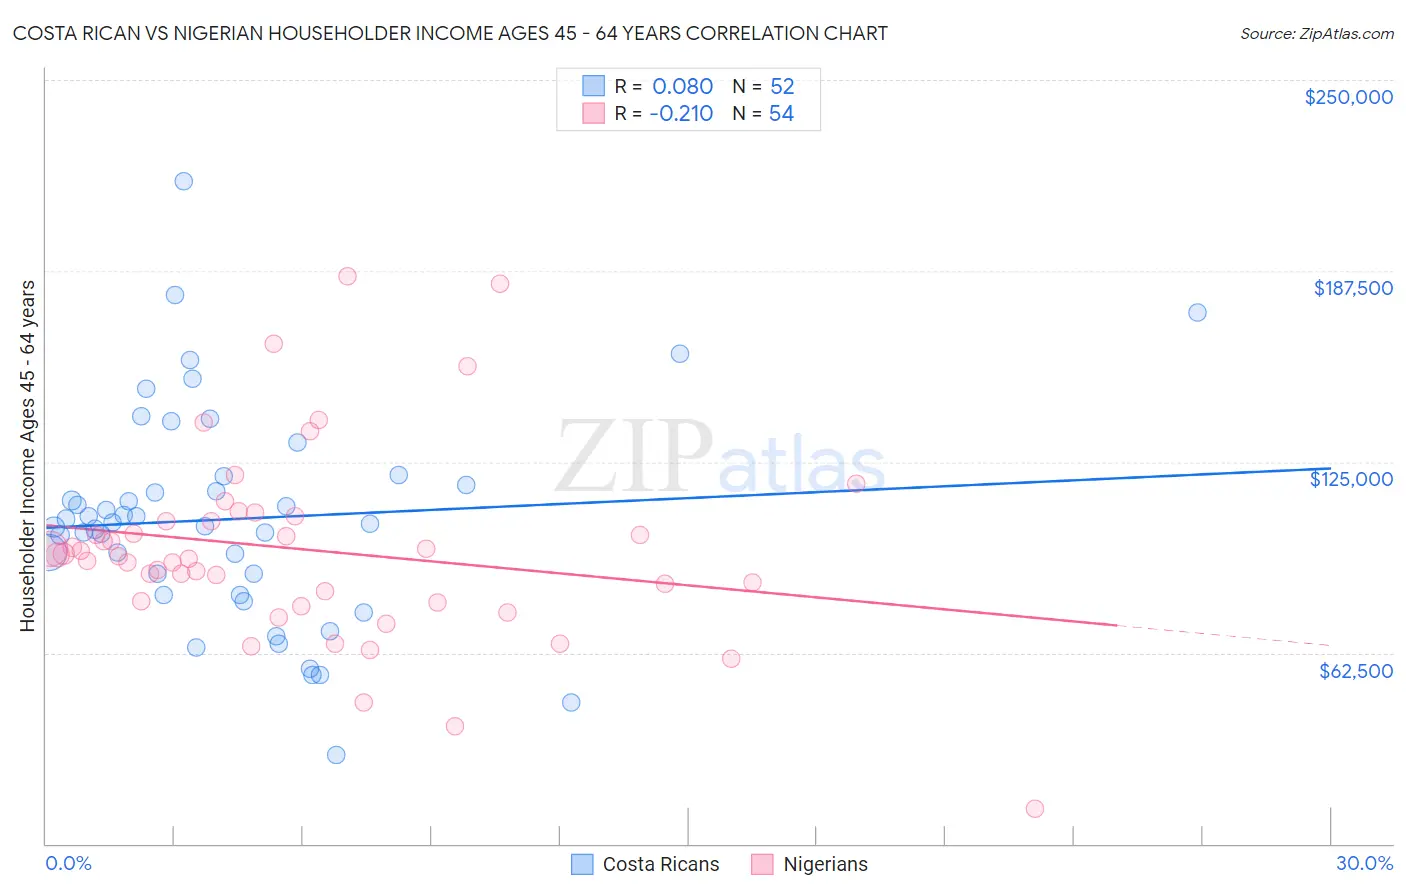
Costa Rican vs Nigerian Householder Income Ages 45 - 64 years Correlation Chart
The statistical analysis conducted on geographies consisting of 253,341,339 people shows a slight positive correlation between the proportion of Costa Ricans and household income with householder between the ages 45 and 64 in the United States with a correlation coefficient (R) of 0.080 and weighted average of $102,779. Similarly, the statistical analysis conducted on geographies consisting of 332,111,540 people shows a weak negative correlation between the proportion of Nigerians and household income with householder between the ages 45 and 64 in the United States with a correlation coefficient (R) of -0.210 and weighted average of $95,492, a difference of 7.6%.
Householder Income Ages 45 - 64 years Correlation Summary
| Measurement | Costa Rican | Nigerian |
| Minimum | $28,864 | $11,458 |
| Maximum | $217,009 | $185,761 |
| Range | $188,145 | $174,303 |
| Mean | $106,317 | $96,275 |
| Median | $104,965 | $94,283 |
| Interquartile 25% (IQ1) | $84,873 | $79,390 |
| Interquartile 75% (IQ3) | $118,891 | $105,427 |
| Interquartile Range (IQR) | $34,017 | $26,037 |
| Standard Deviation (Sample) | $35,393 | $31,417 |
| Standard Deviation (Population) | $35,051 | $31,125 |
Similar Demographics by Householder Income Ages 45 - 64 years
Demographics Similar to Costa Ricans by Householder Income Ages 45 - 64 years
In terms of householder income ages 45 - 64 years, the demographic groups most similar to Costa Ricans are Carpatho Rusyn ($102,777, a difference of 0.0%), Immigrants from Ethiopia ($102,763, a difference of 0.020%), Slovene ($102,885, a difference of 0.10%), Slavic ($102,629, a difference of 0.15%), and Scandinavian ($102,969, a difference of 0.19%).
| Demographics | Rating | Rank | Householder Income Ages 45 - 64 years |
| Immigrants | Germany | 81.5 /100 | #148 | Excellent $103,282 |
| Immigrants | Sierra Leone | 81.1 /100 | #149 | Excellent $103,227 |
| Immigrants | Peru | 80.7 /100 | #150 | Excellent $103,173 |
| Swiss | 79.9 /100 | #151 | Good $103,071 |
| Irish | 79.8 /100 | #152 | Good $103,067 |
| Scandinavians | 79.0 /100 | #153 | Good $102,969 |
| Slovenes | 78.3 /100 | #154 | Good $102,885 |
| Costa Ricans | 77.4 /100 | #155 | Good $102,779 |
| Carpatho Rusyns | 77.4 /100 | #156 | Good $102,777 |
| Immigrants | Ethiopia | 77.3 /100 | #157 | Good $102,763 |
| Slavs | 76.1 /100 | #158 | Good $102,629 |
| Sierra Leoneans | 74.2 /100 | #159 | Good $102,427 |
| Icelanders | 72.5 /100 | #160 | Good $102,261 |
| Immigrants | Nepal | 71.8 /100 | #161 | Good $102,190 |
| Scottish | 71.1 /100 | #162 | Good $102,123 |
Demographics Similar to Nigerians by Householder Income Ages 45 - 64 years
In terms of householder income ages 45 - 64 years, the demographic groups most similar to Nigerians are Immigrants from Venezuela ($95,342, a difference of 0.16%), Immigrants from Ghana ($94,982, a difference of 0.54%), Panamanian ($96,066, a difference of 0.60%), Delaware ($94,914, a difference of 0.61%), and Immigrants from Uruguay ($96,086, a difference of 0.62%).
| Demographics | Rating | Rank | Householder Income Ages 45 - 64 years |
| Scotch-Irish | 16.4 /100 | #208 | Poor $97,073 |
| Japanese | 14.8 /100 | #209 | Poor $96,834 |
| Tsimshian | 14.5 /100 | #210 | Poor $96,783 |
| Immigrants | Cambodia | 13.0 /100 | #211 | Poor $96,537 |
| Venezuelans | 12.6 /100 | #212 | Poor $96,460 |
| Immigrants | Uruguay | 10.7 /100 | #213 | Poor $96,086 |
| Panamanians | 10.6 /100 | #214 | Poor $96,066 |
| Nigerians | 8.2 /100 | #215 | Tragic $95,492 |
| Immigrants | Venezuela | 7.6 /100 | #216 | Tragic $95,342 |
| Immigrants | Ghana | 6.4 /100 | #217 | Tragic $94,982 |
| Delaware | 6.2 /100 | #218 | Tragic $94,914 |
| Immigrants | Armenia | 6.1 /100 | #219 | Tragic $94,863 |
| Salvadorans | 6.0 /100 | #220 | Tragic $94,842 |
| Immigrants | Nigeria | 5.9 /100 | #221 | Tragic $94,804 |
| Malaysians | 5.2 /100 | #222 | Tragic $94,517 |