Cree vs Immigrants from Portugal Householder Income Ages 45 - 64 years
COMPARE
Cree
Immigrants from Portugal
Householder Income Ages 45 - 64 years
Householder Income Ages 45 - 64 years Comparison
Cree
Immigrants from Portugal
$87,185
HOUSEHOLDER INCOME AGES 45 - 64 YEARS
0.1/ 100
METRIC RATING
277th/ 347
METRIC RANK
$99,203
HOUSEHOLDER INCOME AGES 45 - 64 YEARS
36.3/ 100
METRIC RATING
188th/ 347
METRIC RANK
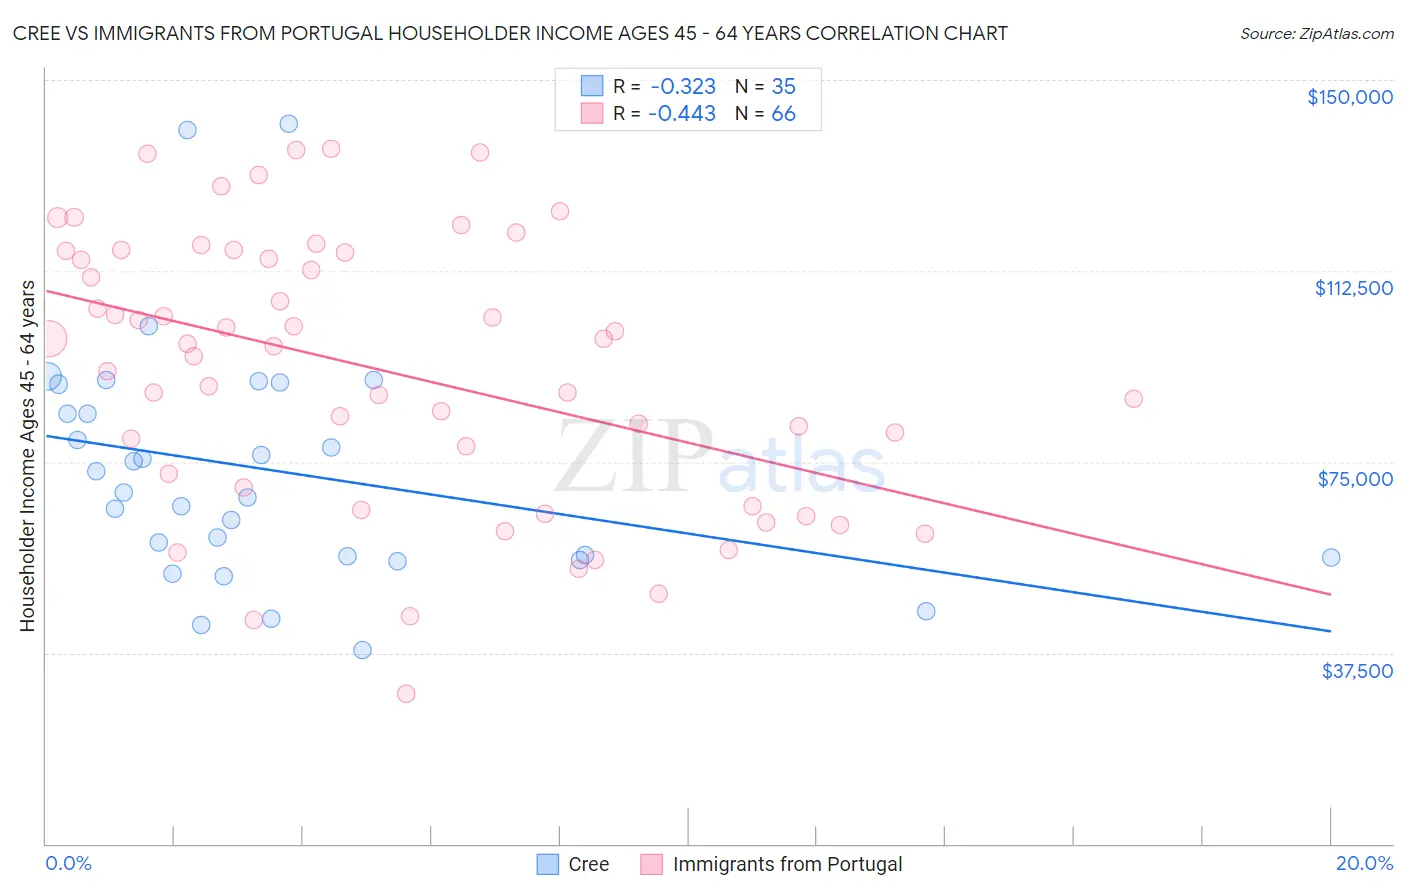
Cree vs Immigrants from Portugal Householder Income Ages 45 - 64 years Correlation Chart
The statistical analysis conducted on geographies consisting of 76,173,826 people shows a mild negative correlation between the proportion of Cree and household income with householder between the ages 45 and 64 in the United States with a correlation coefficient (R) of -0.323 and weighted average of $87,185. Similarly, the statistical analysis conducted on geographies consisting of 174,709,169 people shows a moderate negative correlation between the proportion of Immigrants from Portugal and household income with householder between the ages 45 and 64 in the United States with a correlation coefficient (R) of -0.443 and weighted average of $99,203, a difference of 13.8%.
Householder Income Ages 45 - 64 years Correlation Summary
| Measurement | Cree | Immigrants from Portugal |
| Minimum | $38,125 | $29,554 |
| Maximum | $141,447 | $136,394 |
| Range | $103,322 | $106,840 |
| Mean | $73,266 | $93,039 |
| Median | $69,060 | $97,899 |
| Interquartile 25% (IQ1) | $56,250 | $70,027 |
| Interquartile 75% (IQ3) | $90,223 | $116,103 |
| Interquartile Range (IQR) | $33,973 | $46,076 |
| Standard Deviation (Sample) | $23,520 | $26,518 |
| Standard Deviation (Population) | $23,182 | $26,316 |
Similar Demographics by Householder Income Ages 45 - 64 years
Demographics Similar to Cree by Householder Income Ages 45 - 64 years
In terms of householder income ages 45 - 64 years, the demographic groups most similar to Cree are Immigrants from Latin America ($87,219, a difference of 0.040%), Immigrants from Belize ($87,229, a difference of 0.050%), Iroquois ($87,255, a difference of 0.080%), Immigrants from Jamaica ($87,035, a difference of 0.17%), and Yakama ($86,992, a difference of 0.22%).
| Demographics | Rating | Rank | Householder Income Ages 45 - 64 years |
| Immigrants | Liberia | 0.2 /100 | #270 | Tragic $87,739 |
| Guatemalans | 0.2 /100 | #271 | Tragic $87,705 |
| Cape Verdeans | 0.2 /100 | #272 | Tragic $87,580 |
| Spanish American Indians | 0.2 /100 | #273 | Tragic $87,561 |
| Iroquois | 0.1 /100 | #274 | Tragic $87,255 |
| Immigrants | Belize | 0.1 /100 | #275 | Tragic $87,229 |
| Immigrants | Latin America | 0.1 /100 | #276 | Tragic $87,219 |
| Cree | 0.1 /100 | #277 | Tragic $87,185 |
| Immigrants | Jamaica | 0.1 /100 | #278 | Tragic $87,035 |
| Yakama | 0.1 /100 | #279 | Tragic $86,992 |
| Immigrants | Somalia | 0.1 /100 | #280 | Tragic $86,987 |
| Yaqui | 0.1 /100 | #281 | Tragic $86,914 |
| Senegalese | 0.1 /100 | #282 | Tragic $86,897 |
| Mexicans | 0.1 /100 | #283 | Tragic $86,816 |
| Central American Indians | 0.1 /100 | #284 | Tragic $86,764 |
Demographics Similar to Immigrants from Portugal by Householder Income Ages 45 - 64 years
In terms of householder income ages 45 - 64 years, the demographic groups most similar to Immigrants from Portugal are Immigrants from South America ($99,126, a difference of 0.080%), French Canadian ($99,093, a difference of 0.11%), Iraqi ($99,387, a difference of 0.19%), Kenyan ($98,970, a difference of 0.24%), and Celtic ($98,896, a difference of 0.31%).
| Demographics | Rating | Rank | Householder Income Ages 45 - 64 years |
| Immigrants | Immigrants | 45.3 /100 | #181 | Average $99,943 |
| Finns | 44.8 /100 | #182 | Average $99,904 |
| Spaniards | 44.6 /100 | #183 | Average $99,889 |
| French | 43.8 /100 | #184 | Average $99,824 |
| Colombians | 43.2 /100 | #185 | Average $99,772 |
| Dutch | 41.7 /100 | #186 | Average $99,650 |
| Iraqis | 38.5 /100 | #187 | Fair $99,387 |
| Immigrants | Portugal | 36.3 /100 | #188 | Fair $99,203 |
| Immigrants | South America | 35.4 /100 | #189 | Fair $99,126 |
| French Canadians | 35.1 /100 | #190 | Fair $99,093 |
| Kenyans | 33.7 /100 | #191 | Fair $98,970 |
| Celtics | 32.9 /100 | #192 | Fair $98,896 |
| Hawaiians | 31.6 /100 | #193 | Fair $98,778 |
| Uruguayans | 30.3 /100 | #194 | Fair $98,660 |
| Spanish | 29.2 /100 | #195 | Fair $98,554 |