Cree vs Zimbabwean Householder Income Ages 45 - 64 years
COMPARE
Cree
Zimbabwean
Householder Income Ages 45 - 64 years
Householder Income Ages 45 - 64 years Comparison
Cree
Zimbabweans
$87,185
HOUSEHOLDER INCOME AGES 45 - 64 YEARS
0.1/ 100
METRIC RATING
277th/ 347
METRIC RANK
$106,849
HOUSEHOLDER INCOME AGES 45 - 64 YEARS
96.3/ 100
METRIC RATING
108th/ 347
METRIC RANK
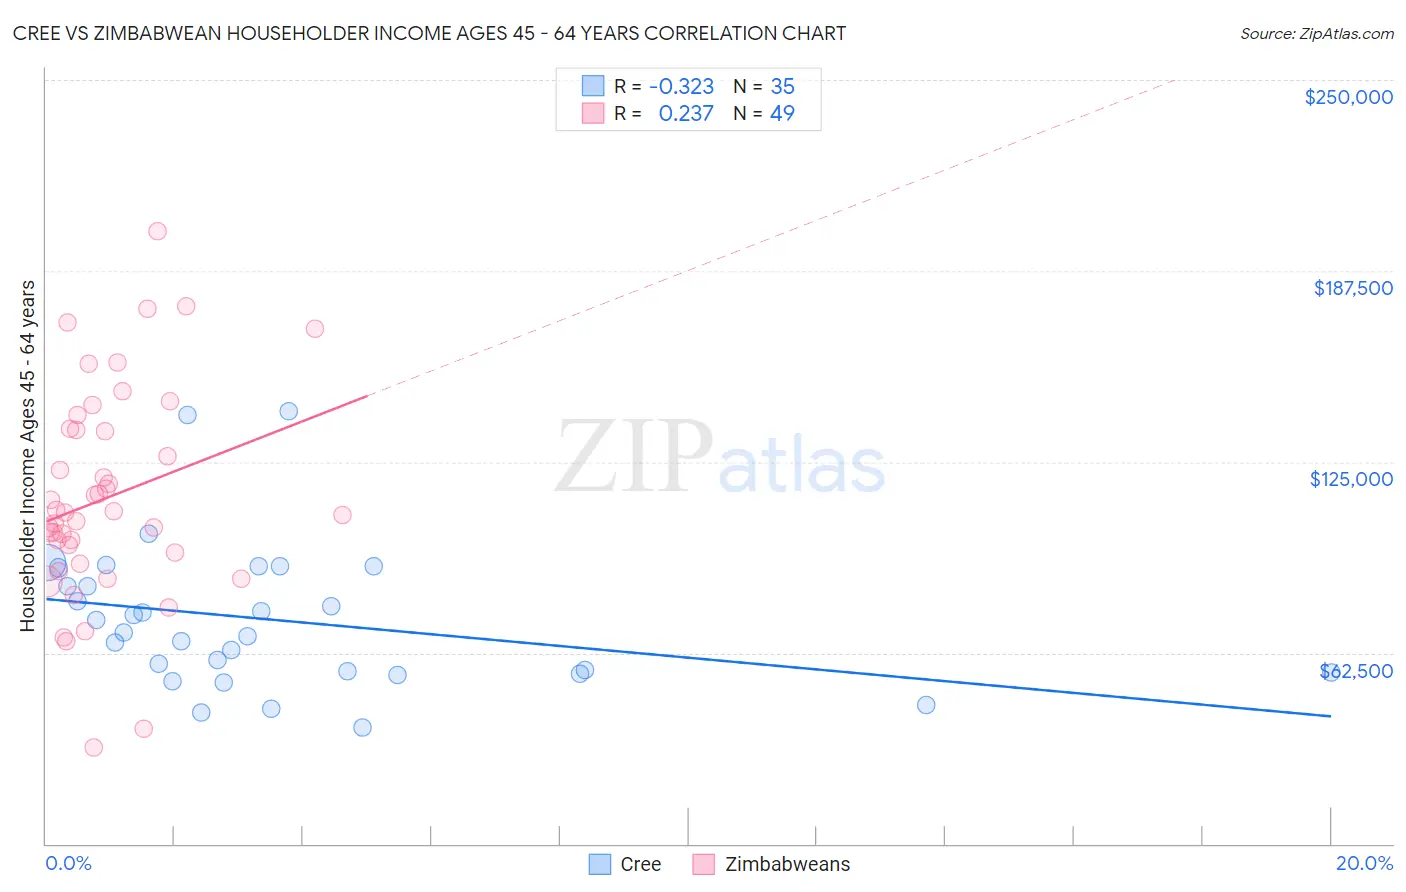
Cree vs Zimbabwean Householder Income Ages 45 - 64 years Correlation Chart
The statistical analysis conducted on geographies consisting of 76,173,826 people shows a mild negative correlation between the proportion of Cree and household income with householder between the ages 45 and 64 in the United States with a correlation coefficient (R) of -0.323 and weighted average of $87,185. Similarly, the statistical analysis conducted on geographies consisting of 69,179,320 people shows a weak positive correlation between the proportion of Zimbabweans and household income with householder between the ages 45 and 64 in the United States with a correlation coefficient (R) of 0.237 and weighted average of $106,849, a difference of 22.6%.
Householder Income Ages 45 - 64 years Correlation Summary
| Measurement | Cree | Zimbabwean |
| Minimum | $38,125 | $31,641 |
| Maximum | $141,447 | $200,450 |
| Range | $103,322 | $168,809 |
| Mean | $73,266 | $113,309 |
| Median | $69,060 | $108,283 |
| Interquartile 25% (IQ1) | $56,250 | $93,481 |
| Interquartile 75% (IQ3) | $90,223 | $135,585 |
| Interquartile Range (IQR) | $33,973 | $42,104 |
| Standard Deviation (Sample) | $23,520 | $34,490 |
| Standard Deviation (Population) | $23,182 | $34,136 |
Similar Demographics by Householder Income Ages 45 - 64 years
Demographics Similar to Cree by Householder Income Ages 45 - 64 years
In terms of householder income ages 45 - 64 years, the demographic groups most similar to Cree are Immigrants from Latin America ($87,219, a difference of 0.040%), Immigrants from Belize ($87,229, a difference of 0.050%), Iroquois ($87,255, a difference of 0.080%), Immigrants from Jamaica ($87,035, a difference of 0.17%), and Yakama ($86,992, a difference of 0.22%).
| Demographics | Rating | Rank | Householder Income Ages 45 - 64 years |
| Immigrants | Liberia | 0.2 /100 | #270 | Tragic $87,739 |
| Guatemalans | 0.2 /100 | #271 | Tragic $87,705 |
| Cape Verdeans | 0.2 /100 | #272 | Tragic $87,580 |
| Spanish American Indians | 0.2 /100 | #273 | Tragic $87,561 |
| Iroquois | 0.1 /100 | #274 | Tragic $87,255 |
| Immigrants | Belize | 0.1 /100 | #275 | Tragic $87,229 |
| Immigrants | Latin America | 0.1 /100 | #276 | Tragic $87,219 |
| Cree | 0.1 /100 | #277 | Tragic $87,185 |
| Immigrants | Jamaica | 0.1 /100 | #278 | Tragic $87,035 |
| Yakama | 0.1 /100 | #279 | Tragic $86,992 |
| Immigrants | Somalia | 0.1 /100 | #280 | Tragic $86,987 |
| Yaqui | 0.1 /100 | #281 | Tragic $86,914 |
| Senegalese | 0.1 /100 | #282 | Tragic $86,897 |
| Mexicans | 0.1 /100 | #283 | Tragic $86,816 |
| Central American Indians | 0.1 /100 | #284 | Tragic $86,764 |
Demographics Similar to Zimbabweans by Householder Income Ages 45 - 64 years
In terms of householder income ages 45 - 64 years, the demographic groups most similar to Zimbabweans are Immigrants from Fiji ($106,952, a difference of 0.10%), Armenian ($107,002, a difference of 0.14%), Macedonian ($107,074, a difference of 0.21%), Immigrants from Ukraine ($107,079, a difference of 0.22%), and Chilean ($106,611, a difference of 0.22%).
| Demographics | Rating | Rank | Householder Income Ages 45 - 64 years |
| Immigrants | Kazakhstan | 97.2 /100 | #101 | Exceptional $107,378 |
| Immigrants | Moldova | 97.1 /100 | #102 | Exceptional $107,357 |
| Syrians | 96.9 /100 | #103 | Exceptional $107,207 |
| Immigrants | Ukraine | 96.7 /100 | #104 | Exceptional $107,079 |
| Macedonians | 96.7 /100 | #105 | Exceptional $107,074 |
| Armenians | 96.6 /100 | #106 | Exceptional $107,002 |
| Immigrants | Fiji | 96.5 /100 | #107 | Exceptional $106,952 |
| Zimbabweans | 96.3 /100 | #108 | Exceptional $106,849 |
| Chileans | 95.9 /100 | #109 | Exceptional $106,611 |
| Immigrants | Brazil | 95.6 /100 | #110 | Exceptional $106,470 |
| Immigrants | Vietnam | 95.5 /100 | #111 | Exceptional $106,417 |
| Swedes | 95.4 /100 | #112 | Exceptional $106,377 |
| Europeans | 95.4 /100 | #113 | Exceptional $106,367 |
| Immigrants | Poland | 95.3 /100 | #114 | Exceptional $106,319 |
| Immigrants | Kuwait | 95.2 /100 | #115 | Exceptional $106,285 |