Norwegian vs Immigrants from Portugal Median Household Income
COMPARE
Norwegian
Immigrants from Portugal
Median Household Income
Median Household Income Comparison
Norwegians
Immigrants from Portugal
$86,084
MEDIAN HOUSEHOLD INCOME
65.3/ 100
METRIC RATING
165th/ 347
METRIC RANK
$84,740
MEDIAN HOUSEHOLD INCOME
44.2/ 100
METRIC RATING
180th/ 347
METRIC RANK
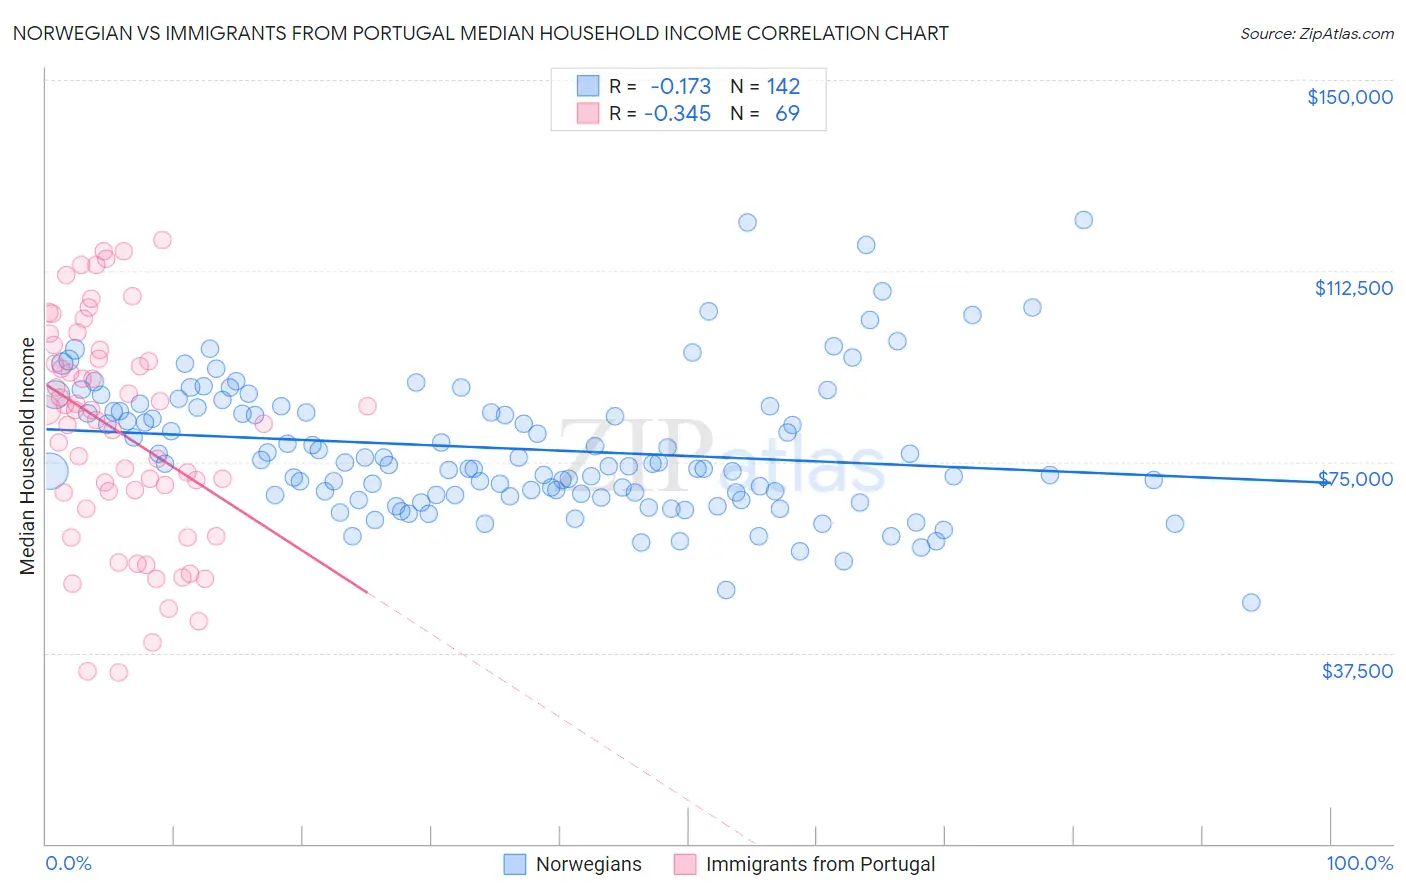
Norwegian vs Immigrants from Portugal Median Household Income Correlation Chart
The statistical analysis conducted on geographies consisting of 532,629,578 people shows a poor negative correlation between the proportion of Norwegians and median household income in the United States with a correlation coefficient (R) of -0.173 and weighted average of $86,084. Similarly, the statistical analysis conducted on geographies consisting of 174,758,543 people shows a mild negative correlation between the proportion of Immigrants from Portugal and median household income in the United States with a correlation coefficient (R) of -0.345 and weighted average of $84,740, a difference of 1.6%.
Median Household Income Correlation Summary
| Measurement | Norwegian | Immigrants from Portugal |
| Minimum | $47,500 | $33,750 |
| Maximum | $122,560 | $118,667 |
| Range | $75,060 | $84,917 |
| Mean | $77,577 | $80,926 |
| Median | $74,729 | $85,116 |
| Interquartile 25% (IQ1) | $68,461 | $67,289 |
| Interquartile 75% (IQ3) | $85,771 | $96,142 |
| Interquartile Range (IQR) | $17,310 | $28,853 |
| Standard Deviation (Sample) | $13,465 | $21,750 |
| Standard Deviation (Population) | $13,417 | $21,592 |
Demographics Similar to Norwegians and Immigrants from Portugal by Median Household Income
In terms of median household income, the demographic groups most similar to Norwegians are Scandinavian ($86,073, a difference of 0.010%), Irish ($86,145, a difference of 0.070%), Czech ($86,164, a difference of 0.090%), Guamanian/Chamorro ($86,255, a difference of 0.20%), and Immigrants ($85,818, a difference of 0.31%). Similarly, the demographic groups most similar to Immigrants from Portugal are Hawaiian ($84,729, a difference of 0.010%), Uruguayan ($84,691, a difference of 0.060%), English ($84,915, a difference of 0.21%), Czechoslovakian ($84,965, a difference of 0.27%), and Immigrants from Eritrea ($85,025, a difference of 0.34%).
| Demographics | Rating | Rank | Median Household Income |
| Guamanians/Chamorros | 67.7 /100 | #162 | Good $86,255 |
| Czechs | 66.4 /100 | #163 | Good $86,164 |
| Irish | 66.2 /100 | #164 | Good $86,145 |
| Norwegians | 65.3 /100 | #165 | Good $86,084 |
| Scandinavians | 65.1 /100 | #166 | Good $86,073 |
| Immigrants | Immigrants | 61.3 /100 | #167 | Good $85,818 |
| Icelanders | 61.0 /100 | #168 | Good $85,797 |
| Colombians | 59.7 /100 | #169 | Average $85,716 |
| Swiss | 59.2 /100 | #170 | Average $85,681 |
| Immigrants | South America | 58.1 /100 | #171 | Average $85,611 |
| Slovenes | 57.4 /100 | #172 | Average $85,562 |
| Immigrants | Cameroon | 53.4 /100 | #173 | Average $85,314 |
| Scottish | 50.0 /100 | #174 | Average $85,101 |
| Immigrants | Costa Rica | 49.2 /100 | #175 | Average $85,054 |
| Alsatians | 49.2 /100 | #176 | Average $85,053 |
| Immigrants | Eritrea | 48.8 /100 | #177 | Average $85,025 |
| Czechoslovakians | 47.8 /100 | #178 | Average $84,965 |
| English | 47.0 /100 | #179 | Average $84,915 |
| Immigrants | Portugal | 44.2 /100 | #180 | Average $84,740 |
| Hawaiians | 44.1 /100 | #181 | Average $84,729 |
| Uruguayans | 43.5 /100 | #182 | Average $84,691 |