Thai vs Immigrants from Kazakhstan Median Earnings
COMPARE
Thai
Immigrants from Kazakhstan
Median Earnings
Median Earnings Comparison
Thais
Immigrants from Kazakhstan
$59,237
MEDIAN EARNINGS
100.0/ 100
METRIC RATING
5th/ 347
METRIC RANK
$50,225
MEDIAN EARNINGS
99.5/ 100
METRIC RATING
85th/ 347
METRIC RANK
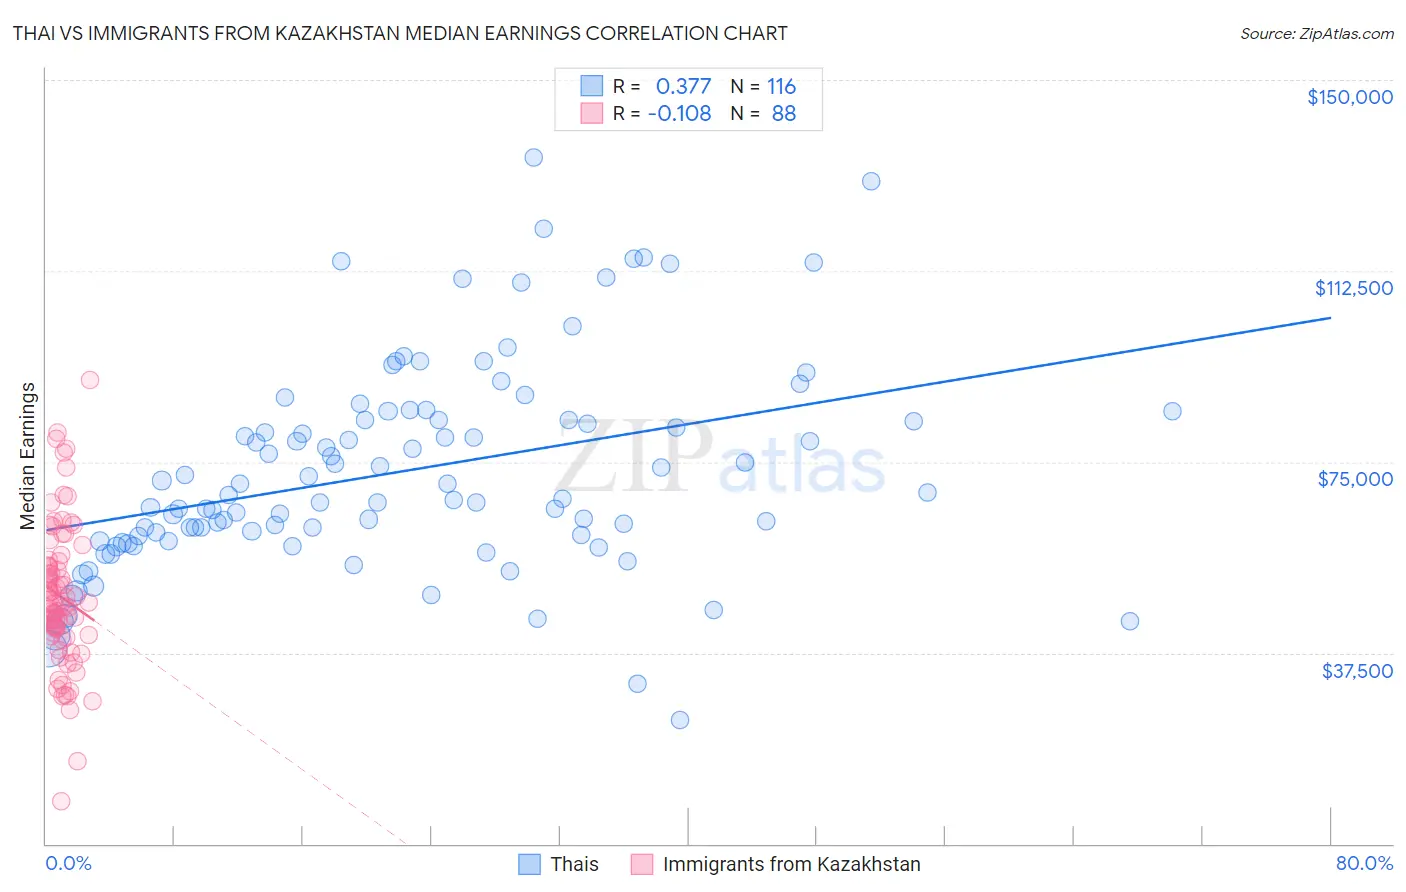
Thai vs Immigrants from Kazakhstan Median Earnings Correlation Chart
The statistical analysis conducted on geographies consisting of 475,851,474 people shows a mild positive correlation between the proportion of Thais and median earnings in the United States with a correlation coefficient (R) of 0.377 and weighted average of $59,237. Similarly, the statistical analysis conducted on geographies consisting of 124,433,453 people shows a poor negative correlation between the proportion of Immigrants from Kazakhstan and median earnings in the United States with a correlation coefficient (R) of -0.108 and weighted average of $50,225, a difference of 17.9%.
Median Earnings Correlation Summary
| Measurement | Thai | Immigrants from Kazakhstan |
| Minimum | $24,353 | $8,274 |
| Maximum | $134,793 | $91,080 |
| Range | $110,440 | $82,806 |
| Mean | $73,089 | $48,545 |
| Median | $68,147 | $47,134 |
| Interquartile 25% (IQ1) | $59,963 | $41,207 |
| Interquartile 75% (IQ3) | $83,196 | $55,074 |
| Interquartile Range (IQR) | $23,232 | $13,868 |
| Standard Deviation (Sample) | $20,568 | $14,031 |
| Standard Deviation (Population) | $20,479 | $13,951 |
Similar Demographics by Median Earnings
Demographics Similar to Thais by Median Earnings
In terms of median earnings, the demographic groups most similar to Thais are Immigrants from Hong Kong ($59,433, a difference of 0.33%), Immigrants from Singapore ($59,038, a difference of 0.34%), Iranian ($58,474, a difference of 1.3%), Immigrants from India ($60,648, a difference of 2.4%), and Immigrants from Iran ($57,612, a difference of 2.8%).
| Demographics | Rating | Rank | Median Earnings |
| Filipinos | 100.0 /100 | #1 | Exceptional $61,197 |
| Immigrants | Taiwan | 100.0 /100 | #2 | Exceptional $61,151 |
| Immigrants | India | 100.0 /100 | #3 | Exceptional $60,648 |
| Immigrants | Hong Kong | 100.0 /100 | #4 | Exceptional $59,433 |
| Thais | 100.0 /100 | #5 | Exceptional $59,237 |
| Immigrants | Singapore | 100.0 /100 | #6 | Exceptional $59,038 |
| Iranians | 100.0 /100 | #7 | Exceptional $58,474 |
| Immigrants | Iran | 100.0 /100 | #8 | Exceptional $57,612 |
| Okinawans | 100.0 /100 | #9 | Exceptional $57,550 |
| Immigrants | South Central Asia | 100.0 /100 | #10 | Exceptional $57,114 |
| Immigrants | Israel | 100.0 /100 | #11 | Exceptional $57,034 |
| Immigrants | Ireland | 100.0 /100 | #12 | Exceptional $56,854 |
| Immigrants | China | 100.0 /100 | #13 | Exceptional $56,638 |
| Immigrants | Australia | 100.0 /100 | #14 | Exceptional $56,305 |
| Indians (Asian) | 100.0 /100 | #15 | Exceptional $56,253 |
Demographics Similar to Immigrants from Kazakhstan by Median Earnings
In terms of median earnings, the demographic groups most similar to Immigrants from Kazakhstan are Immigrants from Hungary ($50,227, a difference of 0.0%), Romanian ($50,244, a difference of 0.040%), Immigrants from Canada ($50,192, a difference of 0.070%), Immigrants from Moldova ($50,274, a difference of 0.10%), and Immigrants from Southern Europe ($50,280, a difference of 0.11%).
| Demographics | Rating | Rank | Median Earnings |
| Argentineans | 99.6 /100 | #78 | Exceptional $50,399 |
| Laotians | 99.6 /100 | #79 | Exceptional $50,343 |
| Ukrainians | 99.6 /100 | #80 | Exceptional $50,320 |
| Immigrants | Southern Europe | 99.6 /100 | #81 | Exceptional $50,280 |
| Immigrants | Moldova | 99.5 /100 | #82 | Exceptional $50,274 |
| Romanians | 99.5 /100 | #83 | Exceptional $50,244 |
| Immigrants | Hungary | 99.5 /100 | #84 | Exceptional $50,227 |
| Immigrants | Kazakhstan | 99.5 /100 | #85 | Exceptional $50,225 |
| Immigrants | Canada | 99.5 /100 | #86 | Exceptional $50,192 |
| Immigrants | Uzbekistan | 99.5 /100 | #87 | Exceptional $50,151 |
| Albanians | 99.4 /100 | #88 | Exceptional $50,116 |
| Immigrants | North America | 99.4 /100 | #89 | Exceptional $50,108 |
| Italians | 99.3 /100 | #90 | Exceptional $49,915 |
| Macedonians | 99.2 /100 | #91 | Exceptional $49,893 |
| Immigrants | Argentina | 99.2 /100 | #92 | Exceptional $49,841 |