Northern European vs Immigrants from Kazakhstan Median Earnings
COMPARE
Northern European
Immigrants from Kazakhstan
Median Earnings
Median Earnings Comparison
Northern Europeans
Immigrants from Kazakhstan
$48,887
MEDIAN EARNINGS
96.9/ 100
METRIC RATING
112th/ 347
METRIC RANK
$50,225
MEDIAN EARNINGS
99.5/ 100
METRIC RATING
85th/ 347
METRIC RANK
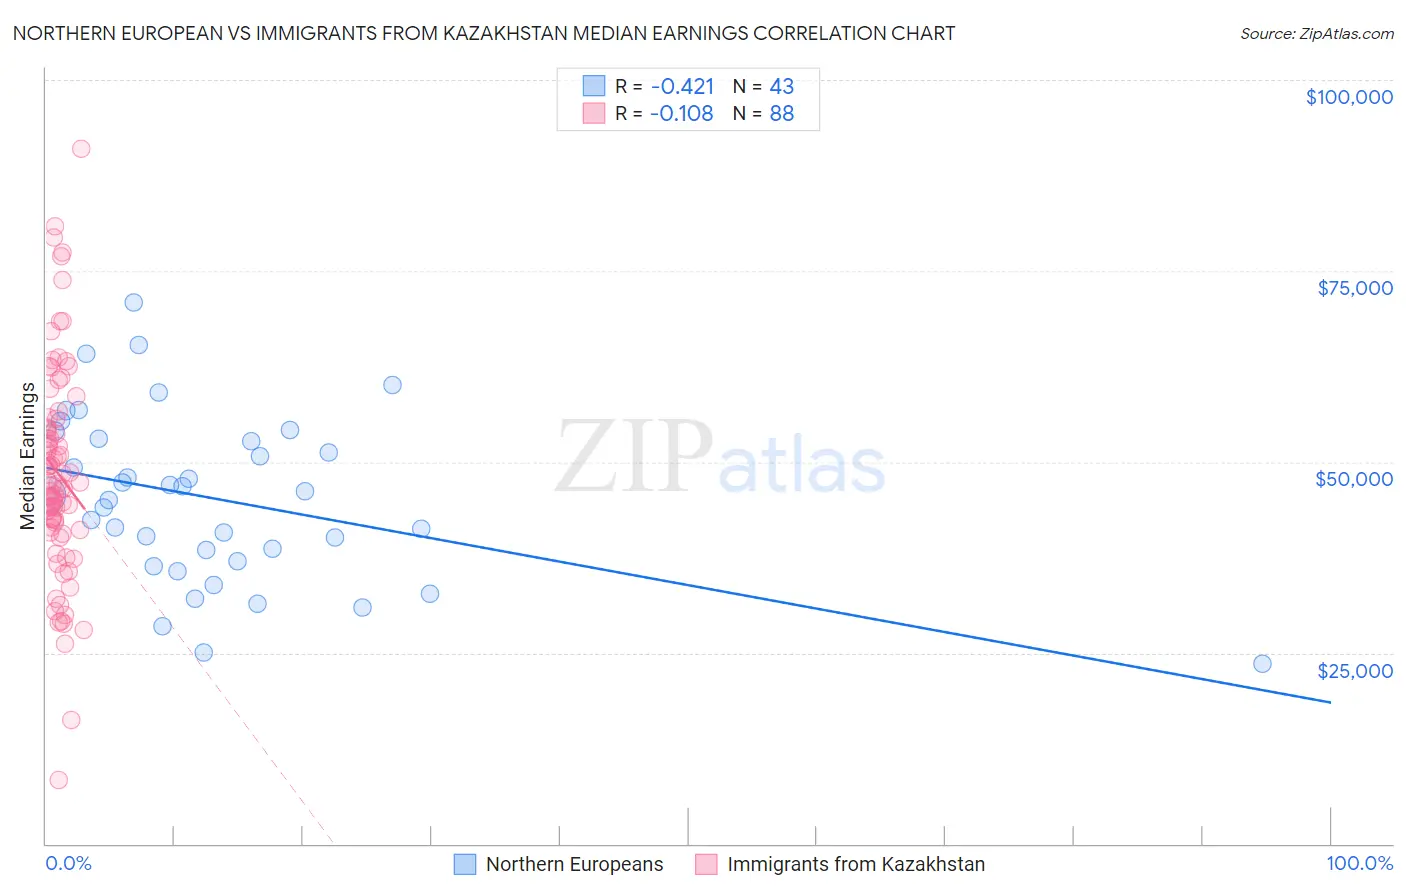
Northern European vs Immigrants from Kazakhstan Median Earnings Correlation Chart
The statistical analysis conducted on geographies consisting of 406,030,818 people shows a moderate negative correlation between the proportion of Northern Europeans and median earnings in the United States with a correlation coefficient (R) of -0.421 and weighted average of $48,887. Similarly, the statistical analysis conducted on geographies consisting of 124,433,453 people shows a poor negative correlation between the proportion of Immigrants from Kazakhstan and median earnings in the United States with a correlation coefficient (R) of -0.108 and weighted average of $50,225, a difference of 2.7%.
Median Earnings Correlation Summary
| Measurement | Northern European | Immigrants from Kazakhstan |
| Minimum | $23,571 | $8,274 |
| Maximum | $70,939 | $91,080 |
| Range | $47,368 | $82,806 |
| Mean | $45,160 | $48,545 |
| Median | $45,714 | $47,134 |
| Interquartile 25% (IQ1) | $37,035 | $41,207 |
| Interquartile 75% (IQ3) | $52,998 | $55,074 |
| Interquartile Range (IQR) | $15,963 | $13,868 |
| Standard Deviation (Sample) | $10,934 | $14,031 |
| Standard Deviation (Population) | $10,806 | $13,951 |
Similar Demographics by Median Earnings
Demographics Similar to Northern Europeans by Median Earnings
In terms of median earnings, the demographic groups most similar to Northern Europeans are Immigrants from Zimbabwe ($48,913, a difference of 0.050%), Immigrants from Kuwait ($48,861, a difference of 0.050%), Immigrants from Ethiopia ($48,924, a difference of 0.070%), Syrian ($48,934, a difference of 0.10%), and Moroccan ($48,838, a difference of 0.10%).
| Demographics | Rating | Rank | Median Earnings |
| Immigrants | Western Asia | 98.4 /100 | #105 | Exceptional $49,389 |
| Immigrants | Albania | 98.4 /100 | #106 | Exceptional $49,377 |
| Immigrants | Morocco | 98.4 /100 | #107 | Exceptional $49,368 |
| Palestinians | 98.0 /100 | #108 | Exceptional $49,209 |
| Syrians | 97.1 /100 | #109 | Exceptional $48,934 |
| Immigrants | Ethiopia | 97.1 /100 | #110 | Exceptional $48,924 |
| Immigrants | Zimbabwe | 97.0 /100 | #111 | Exceptional $48,913 |
| Northern Europeans | 96.9 /100 | #112 | Exceptional $48,887 |
| Immigrants | Kuwait | 96.8 /100 | #113 | Exceptional $48,861 |
| Moroccans | 96.7 /100 | #114 | Exceptional $48,838 |
| Chinese | 96.7 /100 | #115 | Exceptional $48,836 |
| Koreans | 96.2 /100 | #116 | Exceptional $48,727 |
| Serbians | 95.9 /100 | #117 | Exceptional $48,677 |
| Immigrants | Jordan | 95.9 /100 | #118 | Exceptional $48,673 |
| Poles | 95.8 /100 | #119 | Exceptional $48,659 |
Demographics Similar to Immigrants from Kazakhstan by Median Earnings
In terms of median earnings, the demographic groups most similar to Immigrants from Kazakhstan are Immigrants from Hungary ($50,227, a difference of 0.0%), Romanian ($50,244, a difference of 0.040%), Immigrants from Canada ($50,192, a difference of 0.070%), Immigrants from Moldova ($50,274, a difference of 0.10%), and Immigrants from Southern Europe ($50,280, a difference of 0.11%).
| Demographics | Rating | Rank | Median Earnings |
| Argentineans | 99.6 /100 | #78 | Exceptional $50,399 |
| Laotians | 99.6 /100 | #79 | Exceptional $50,343 |
| Ukrainians | 99.6 /100 | #80 | Exceptional $50,320 |
| Immigrants | Southern Europe | 99.6 /100 | #81 | Exceptional $50,280 |
| Immigrants | Moldova | 99.5 /100 | #82 | Exceptional $50,274 |
| Romanians | 99.5 /100 | #83 | Exceptional $50,244 |
| Immigrants | Hungary | 99.5 /100 | #84 | Exceptional $50,227 |
| Immigrants | Kazakhstan | 99.5 /100 | #85 | Exceptional $50,225 |
| Immigrants | Canada | 99.5 /100 | #86 | Exceptional $50,192 |
| Immigrants | Uzbekistan | 99.5 /100 | #87 | Exceptional $50,151 |
| Albanians | 99.4 /100 | #88 | Exceptional $50,116 |
| Immigrants | North America | 99.4 /100 | #89 | Exceptional $50,108 |
| Italians | 99.3 /100 | #90 | Exceptional $49,915 |
| Macedonians | 99.2 /100 | #91 | Exceptional $49,893 |
| Immigrants | Argentina | 99.2 /100 | #92 | Exceptional $49,841 |